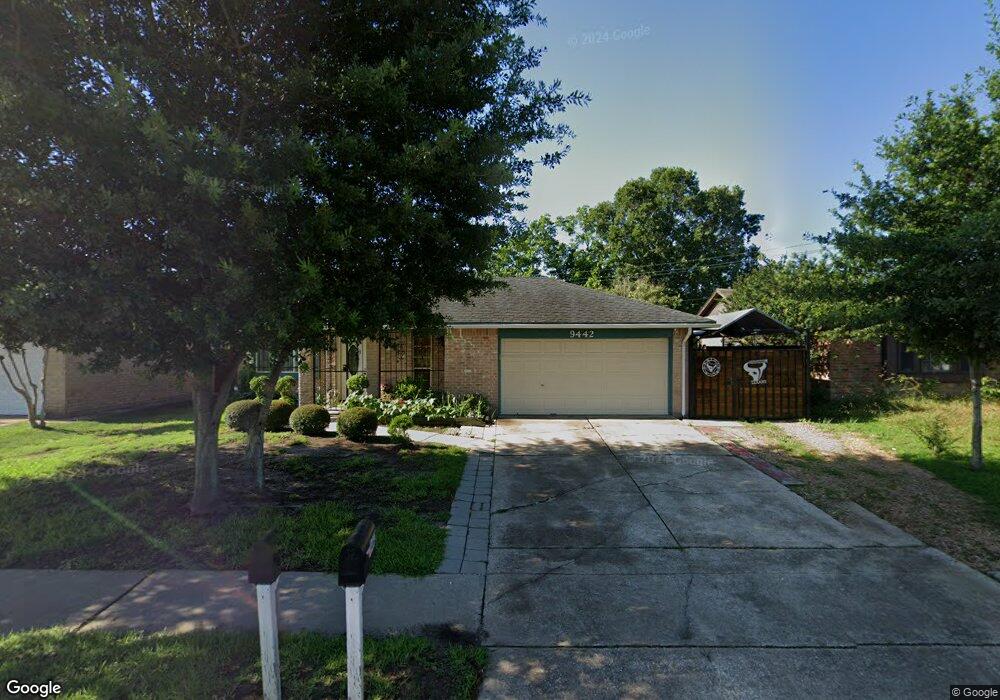
9442 Fuqua St Houston, TX 77075
Southbelt-Ellington NeighborhoodEstimated Value: $209,883 - $224,000
3
Beds
2
Baths
1,065
Sq Ft
$202/Sq Ft
Est. Value
About This Home
This home is located at 9442 Fuqua St, Houston, TX 77075 and is currently estimated at $215,221, approximately $202 per square foot. 9442 Fuqua St is a home located in Harris County with nearby schools including Atkinson Elementary School, Morris Middle School, and Beverly Hill Intermediate School.
Ownership History
Date
Name
Owned For
Owner Type
Purchase Details
Closed on
Oct 16, 2006
Sold by
Tamayo Hipolito and Tamayo Annette
Bought by
Pantoja Juan
Current Estimated Value
Home Financials for this Owner
Home Financials are based on the most recent Mortgage that was taken out on this home.
Original Mortgage
$56,000
Outstanding Balance
$33,379
Interest Rate
6.44%
Mortgage Type
Stand Alone First
Estimated Equity
$181,842
Create a Home Valuation Report for This Property
The Home Valuation Report is an in-depth analysis detailing your home's value as well as a comparison with similar homes in the area
Home Values in the Area
Average Home Value in this Area
Purchase History
| Date | Buyer | Sale Price | Title Company |
|---|---|---|---|
| Pantoja Juan | -- | Texas American Title Company |
Source: Public Records
Mortgage History
| Date | Status | Borrower | Loan Amount |
|---|---|---|---|
| Open | Pantoja Juan | $56,000 |
Source: Public Records
Tax History Compared to Growth
Tax History
| Year | Tax Paid | Tax Assessment Tax Assessment Total Assessment is a certain percentage of the fair market value that is determined by local assessors to be the total taxable value of land and additions on the property. | Land | Improvement |
|---|---|---|---|---|
| 2025 | $2,501 | $179,588 | $52,750 | $126,838 |
| 2024 | $2,501 | $173,116 | $43,519 | $129,597 |
| 2023 | $2,501 | $180,933 | $43,519 | $137,414 |
| 2022 | $4,115 | $166,759 | $43,519 | $123,240 |
| 2021 | $3,925 | $146,286 | $43,519 | $102,767 |
| 2020 | $3,641 | $132,835 | $39,563 | $93,272 |
| 2019 | $3,590 | $129,858 | $36,266 | $93,592 |
| 2018 | $1,302 | $113,217 | $28,024 | $85,193 |
| 2017 | $2,864 | $110,484 | $28,024 | $82,460 |
| 2016 | $2,604 | $94,547 | $23,078 | $71,469 |
| 2015 | $1,748 | $87,281 | $23,078 | $64,203 |
| 2014 | $1,748 | $81,156 | $23,078 | $58,078 |
Source: Public Records
Map
Nearby Homes
- 9423 Garden Bridge St
- 10610 Stover St
- 9602 Sumerlin St
- 9319 Canady Park Ln
- 9610 Sumerlin St
- 10906 Stover St
- 10831 Cayman Mist Dr
- 10827 Linden Gate Dr
- 7329 Madison Commons Ln
- 7322 Madison Commons Ln
- 9721 Foredale St
- 10518 Tenleyton Ln
- 0 Fuqua St Unit 64883593
- 0 Fuqua St Unit 45902141
- 0 Fuqua St Unit 97219329
- 9411 Kingsvalley St
- 10918 Linden Gate Dr
- 10410 Stover St
- 9914 Sumerlin St
- 9420 Savannah Holly Dr
- 9446 Fuqua St
- 9438 Fuqua St
- 9423 Misty Bridge St
- 9427 Misty Bridge St
- 9434 Fuqua St
- 9419 Misty Bridge St
- 9431 Misty Bridge St
- 9454 Fuqua St
- 9435 Misty Bridge St
- 9415 Misty Bridge St
- 9458 Fuqua St
- 9439 Misty Bridge St
- 9430 Misty Bridge St
- 9411 Misty Bridge St
- 9462 Fuqua St
- 9434 Misty Bridge St
- 9443 Misty Bridge St
- 9438 Misty Bridge St
- 9407 Misty Bridge St
- 9502 Fuqua St