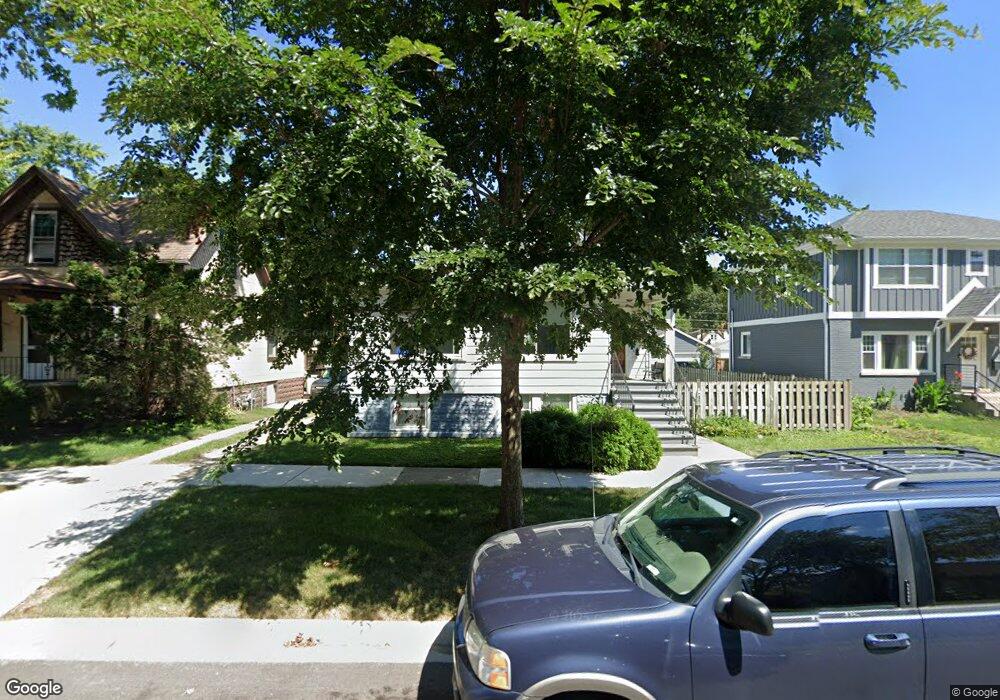
9442 Jefferson Ave Brookfield, IL 60513
Estimated Value: $386,276 - $456,000
4
Beds
2
Baths
1,628
Sq Ft
$256/Sq Ft
Est. Value
About This Home
This home is located at 9442 Jefferson Ave, Brookfield, IL 60513 and is currently estimated at $416,092, approximately $255 per square foot. 9442 Jefferson Ave is a home located in Cook County with nearby schools including S. E. Gross Middle School, Brook Park Elementary School, and Riverside Brookfield High School.
Ownership History
Date
Name
Owned For
Owner Type
Purchase Details
Closed on
Jun 28, 2018
Sold by
2018 3 Ih Borrower Lp
Bought by
Ih2 Property Illinois L P
Current Estimated Value
Purchase Details
Closed on
Jun 25, 2015
Sold by
Ih2 Property Illinois Lp
Bought by
2015 & 3 Ih2 Borrower Lp
Purchase Details
Closed on
May 24, 2013
Sold by
Diethelm Joseph A
Bought by
Ih2 Property Illinois Lp
Purchase Details
Closed on
May 6, 2004
Sold by
Taylorbank Cole
Bought by
Diethelm Joseph A
Home Financials for this Owner
Home Financials are based on the most recent Mortgage that was taken out on this home.
Original Mortgage
$195,000
Interest Rate
4.62%
Mortgage Type
Negative Amortization
Purchase Details
Closed on
Jun 1, 1998
Sold by
Webb Andrew J and Webb Carol M
Bought by
Cole Taylor Bank and Trust #984464
Home Financials for this Owner
Home Financials are based on the most recent Mortgage that was taken out on this home.
Original Mortgage
$113,200
Interest Rate
7.17%
Create a Home Valuation Report for This Property
The Home Valuation Report is an in-depth analysis detailing your home's value as well as a comparison with similar homes in the area
Home Values in the Area
Average Home Value in this Area
Purchase History
| Date | Buyer | Sale Price | Title Company |
|---|---|---|---|
| Ih2 Property Illinois L P | -- | Os National Llc | |
| 2015 & 3 Ih2 Borrower Lp | -- | None Available | |
| Ih2 Property Illinois Lp | $105,500 | None Available | |
| Diethelm Joseph A | -- | Git | |
| Cole Taylor Bank | $141,500 | -- |
Source: Public Records
Mortgage History
| Date | Status | Borrower | Loan Amount |
|---|---|---|---|
| Previous Owner | Diethelm Joseph A | $195,000 | |
| Previous Owner | Cole Taylor Bank | $113,200 |
Source: Public Records
Tax History Compared to Growth
Tax History
| Year | Tax Paid | Tax Assessment Tax Assessment Total Assessment is a certain percentage of the fair market value that is determined by local assessors to be the total taxable value of land and additions on the property. | Land | Improvement |
|---|---|---|---|---|
| 2024 | $10,254 | $28,718 | $4,688 | $24,030 |
| 2023 | $9,792 | $28,718 | $4,688 | $24,030 |
| 2022 | $9,792 | $23,501 | $4,063 | $19,438 |
| 2021 | $9,499 | $23,500 | $4,062 | $19,438 |
| 2020 | $9,254 | $23,500 | $4,062 | $19,438 |
| 2019 | $9,719 | $24,645 | $3,593 | $21,052 |
| 2018 | $9,332 | $24,645 | $3,593 | $21,052 |
| 2017 | $8,603 | $24,645 | $3,593 | $21,052 |
| 2016 | $6,303 | $16,934 | $3,281 | $13,653 |
| 2015 | $6,059 | $16,934 | $3,281 | $13,653 |
| 2014 | $6,812 | $19,320 | $3,281 | $16,039 |
| 2013 | -- | $19,174 | $3,281 | $15,893 |
Source: Public Records
Map
Nearby Homes
- 3336 Grand Blvd
- 3251 Grand Blvd
- 9532 Jackson Ave
- 9532 Lexington Ave
- 3229 Maple Ave
- 3128 Arthur Ave
- 3800 Harrison Ave
- 525 Homestead Rd
- 3417 Oak Ave
- 326 Kemman Ave
- 3617 Park Ave
- 3545 Oak Ave
- 314 Beach Ave
- 3328 Vernon Ave
- 3108 Oak Ave
- 3117 Oak Ave
- 1245 Morgan Ave
- 3923 Madison Ave
- 1427 Cleveland Ave
- 3931 Maple Ave
- 9446 Jefferson Ave
- 9436 Jefferson Ave
- 9432 Jefferson Ave
- 9445 Monroe Ave
- 9441 Monroe Ave
- 9437 Monroe Ave
- 9426 Jefferson Ave
- 9500 Jefferson Ave
- 9431 Monroe Ave
- 9441 Jefferson Ave
- 9447 Jefferson Ave
- 9437 Jefferson Ave
- 9435 Jefferson Ave
- 9506 Jefferson Ave
- 9501 Monroe Ave
- 9431 Jefferson Ave
- 9425 Monroe Ave
- 9420 Jefferson Ave
- 9501 Jefferson Ave
- 9505 Monroe Ave