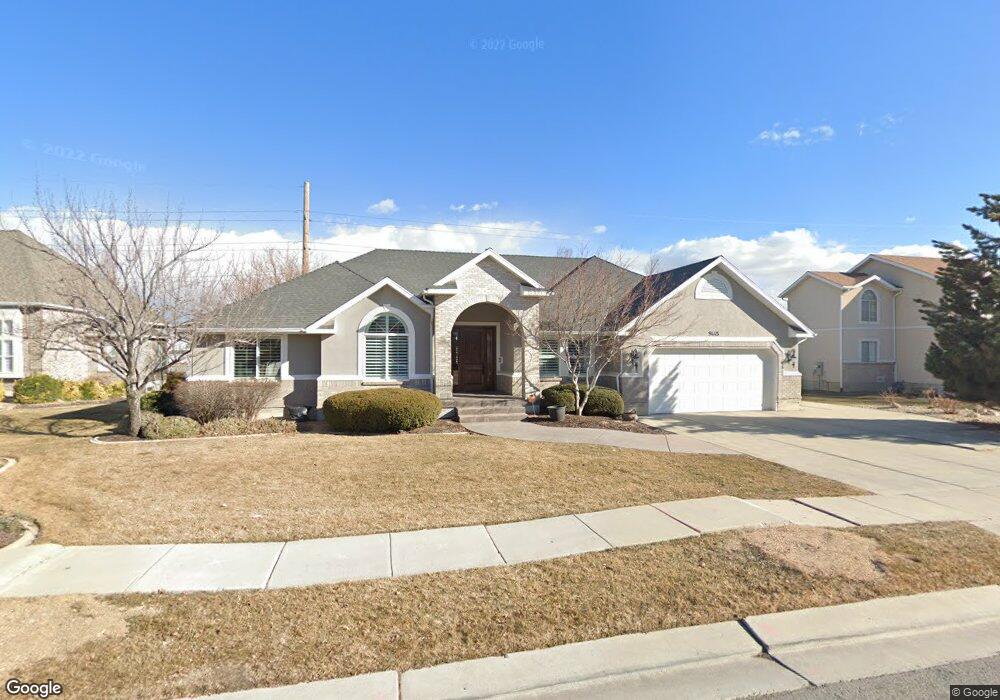
9445 Dunbar Cove South Jordan, UT 84095
Estimated Value: $814,000 - $1,013,000
2
Beds
3
Baths
2,187
Sq Ft
$404/Sq Ft
Est. Value
About This Home
This home is located at 9445 Dunbar Cove, South Jordan, UT 84095 and is currently estimated at $884,390, approximately $404 per square foot. 9445 Dunbar Cove is a home located in Salt Lake County with nearby schools including Jordan Ridge School, South Jordan Middle School, and Hawthorn Academy.
Ownership History
Date
Name
Owned For
Owner Type
Purchase Details
Closed on
Aug 20, 2020
Sold by
Christensen Michael E and Christensen Denise B
Bought by
Christensen Micahel Elvin and Christensen Denise Barrus
Current Estimated Value
Purchase Details
Closed on
Nov 9, 1994
Sold by
Woolley Robison Homes And Development
Bought by
Christensen Michael E and Christensen Denise B
Home Financials for this Owner
Home Financials are based on the most recent Mortgage that was taken out on this home.
Original Mortgage
$178,600
Interest Rate
8.86%
Purchase Details
Closed on
Feb 8, 1994
Sold by
Heatherwood Inc
Bought by
Woolley Robison Homes And Development
Purchase Details
Closed on
Feb 3, 1994
Sold by
Hallmeyer David W and Hallmeyer Emiko T
Bought by
Heatherwood Inc
Create a Home Valuation Report for This Property
The Home Valuation Report is an in-depth analysis detailing your home's value as well as a comparison with similar homes in the area
Home Values in the Area
Average Home Value in this Area
Purchase History
| Date | Buyer | Sale Price | Title Company |
|---|---|---|---|
| Christensen Micahel Elvin | -- | None Available | |
| Christensen Michael E | -- | -- | |
| Woolley Robison Homes And Development | -- | -- | |
| Heatherwood Inc | -- | -- |
Source: Public Records
Mortgage History
| Date | Status | Borrower | Loan Amount |
|---|---|---|---|
| Closed | Christensen Michael E | $178,600 |
Source: Public Records
Tax History Compared to Growth
Tax History
| Year | Tax Paid | Tax Assessment Tax Assessment Total Assessment is a certain percentage of the fair market value that is determined by local assessors to be the total taxable value of land and additions on the property. | Land | Improvement |
|---|---|---|---|---|
| 2025 | $4,132 | $839,000 | $259,800 | $579,200 |
| 2024 | $4,132 | $784,600 | $242,500 | $542,100 |
| 2023 | $4,082 | $731,300 | $233,200 | $498,100 |
| 2022 | $4,049 | $710,900 | $228,600 | $482,300 |
| 2021 | $3,517 | $566,600 | $182,900 | $383,700 |
| 2020 | $3,597 | $543,200 | $143,000 | $400,200 |
| 2019 | $3,549 | $526,800 | $134,900 | $391,900 |
| 2018 | $3,392 | $501,000 | $134,900 | $366,100 |
| 2017 | $3,199 | $463,000 | $134,900 | $328,100 |
| 2016 | $3,115 | $427,300 | $134,900 | $292,400 |
| 2015 | $3,130 | $417,400 | $154,100 | $263,300 |
| 2014 | $3,005 | $393,800 | $146,900 | $246,900 |
Source: Public Records
Map
Nearby Homes
- 1673 Peaceful Cir
- 9635 S 1600 W
- Brook Haven Plan at Jordan Woods
- Maple Plan at Jordan Woods
- The Maple Basement Plan at Jordan Woods
- The Evergreen Basement Plan at Jordan Woods
- 9503 S Tirado Cove Unit 203
- 9511 S Tirado Cove Unit 204
- 1719 W Brocious Way Unit 301
- 8686 S Temple Dr
- 1753 Rylie Ann Cir
- 1741 W Nikos Ln
- 1718 W Thira Ln
- 9141 S Little Creek Dr
- 1767 W Ikaros Ln
- 1788 W Ikaros Ln
- 9496 S 1930 W
- 9414 S 1980 W
- 9847 S Castello Ct Unit 5
- 1968 W 9270 S Unit C
- 9459 S Dunbar Cove
- 9459 Dunbar Cove
- 9433 Dunbar Cove
- 9446 Morywood Cir
- 9458 S Morywood Cir
- 9458 Morywood Cir
- 9444 Dunbar Cove
- 9429 Dunbar Cove
- 1544 Heather Downs Dr
- 9432 Dunbar Cove
- 1513 Heather Downs Dr
- 9422 S Morywood Cir
- 9422 Morywood Cir
- 9423 Dunbar Cove
- 1489 Heather Downs Dr
- 9428 Dunbar Cove
- 1545 Heather Downs Dr
- 9497 S Dunbar Cir
- 9497 Dunbar Cir
- 1566 W Heather Downs Dr