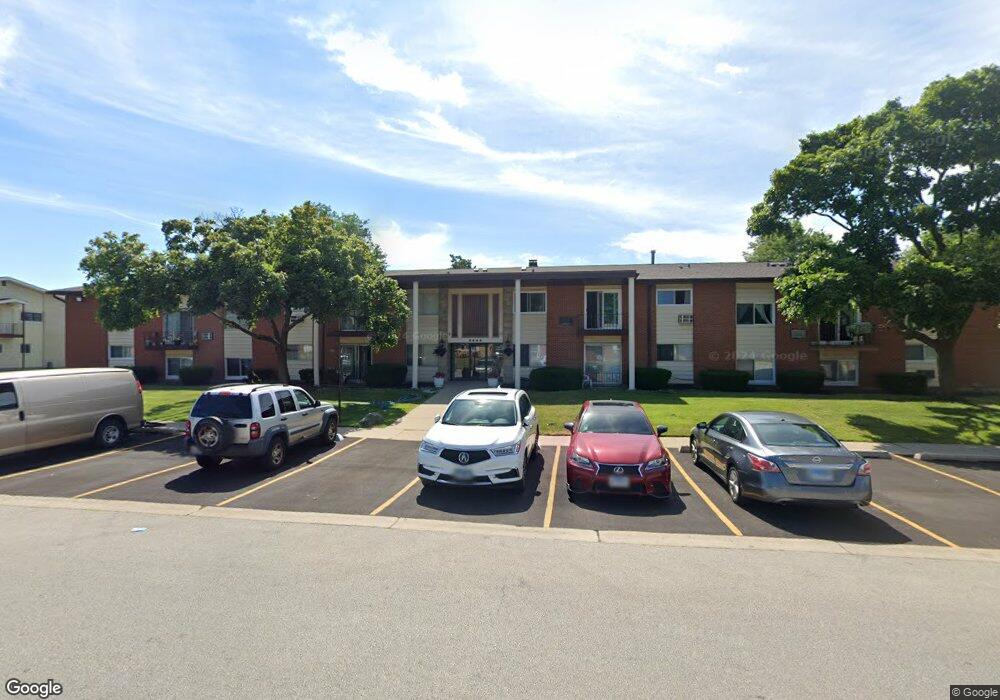
9446 Dee Rd Unit 203C Des Plaines, IL 60016
Estimated Value: $163,000 - $210,000
2
Beds
--
Bath
1,082
Sq Ft
$174/Sq Ft
Est. Value
About This Home
This home is located at 9446 Dee Rd Unit 203C, Des Plaines, IL 60016 and is currently estimated at $188,544, approximately $174 per square foot. 9446 Dee Rd Unit 203C is a home located in Cook County with nearby schools including Apollo Elementary School, Gemini Middle School, and Maine East High School.
Ownership History
Date
Name
Owned For
Owner Type
Purchase Details
Closed on
Aug 28, 2019
Sold by
Arkalious Larry Y and Bobo Navin B
Bought by
Hingu Shital J
Current Estimated Value
Home Financials for this Owner
Home Financials are based on the most recent Mortgage that was taken out on this home.
Original Mortgage
$111,200
Outstanding Balance
$96,961
Interest Rate
3.8%
Mortgage Type
New Conventional
Estimated Equity
$91,583
Purchase Details
Closed on
Mar 5, 2007
Sold by
Martin Greg
Bought by
Arkalious Larry Y and Robo Navin B
Home Financials for this Owner
Home Financials are based on the most recent Mortgage that was taken out on this home.
Original Mortgage
$147,000
Interest Rate
9.24%
Mortgage Type
Purchase Money Mortgage
Purchase Details
Closed on
Jan 31, 2007
Sold by
Quattrocchi Angeline
Bought by
Martin Greg
Home Financials for this Owner
Home Financials are based on the most recent Mortgage that was taken out on this home.
Original Mortgage
$147,000
Interest Rate
9.24%
Mortgage Type
Purchase Money Mortgage
Create a Home Valuation Report for This Property
The Home Valuation Report is an in-depth analysis detailing your home's value as well as a comparison with similar homes in the area
Home Values in the Area
Average Home Value in this Area
Purchase History
| Date | Buyer | Sale Price | Title Company |
|---|---|---|---|
| Hingu Shital J | $139,000 | Fidelity National Title Ins | |
| Arkalious Larry Y | $147,000 | Multiple | |
| Arkalious Larry Y | $147,000 | Multiple | |
| Martin Greg | $119,500 | Multiple |
Source: Public Records
Mortgage History
| Date | Status | Borrower | Loan Amount |
|---|---|---|---|
| Open | Hingu Shital J | $111,200 | |
| Previous Owner | Arkalious Larry Y | $147,000 |
Source: Public Records
Tax History
| Year | Tax Paid | Tax Assessment Tax Assessment Total Assessment is a certain percentage of the fair market value that is determined by local assessors to be the total taxable value of land and additions on the property. | Land | Improvement |
|---|---|---|---|---|
| 2025 | $3,677 | $14,029 | $593 | $13,436 |
| 2024 | $3,677 | $13,568 | $482 | $13,086 |
| 2023 | $3,497 | $13,568 | $482 | $13,086 |
| 2022 | $3,497 | $13,568 | $482 | $13,086 |
| 2021 | $2,329 | $7,418 | $740 | $6,678 |
| 2020 | $2,275 | $7,418 | $740 | $6,678 |
| 2019 | $1,960 | $10,693 | $740 | $9,953 |
| 2018 | $788 | $5,999 | $648 | $5,351 |
| 2017 | $796 | $5,999 | $648 | $5,351 |
| 2016 | $991 | $5,999 | $648 | $5,351 |
| 2015 | $1,419 | $7,214 | $555 | $6,659 |
| 2014 | $1,386 | $7,214 | $555 | $6,659 |
| 2013 | $1,345 | $7,214 | $555 | $6,659 |
Source: Public Records
Map
Nearby Homes
- 9446 Dee Rd Unit 2F
- 9500 Dee Rd Unit 202B
- 9546 Dee Rd Unit 1F
- 9561 Dee Rd Unit 2D
- 9412 Margail Ave
- 9588 Terrace Place Unit 1F
- 9588 Terrace Place Unit 1C
- 9588 N Terrace Place Unit 208H
- 9575 Terrace Place Unit 206F
- 9209 Potter Rd Unit 2F
- 9619 Bianco Terrace Unit D
- 9413 Meadow Ln
- 9454 Meadow Ln
- 9128 W Terrace Dr Unit 2D
- 9128 W Terrace Dr Unit 3M
- 9128 W Terrace Dr Unit 91283B
- 9128 W Dr
- 9098 W Terrace Dr Unit 1L
- 9356 N Parkside Dr
- 9074 W Terrace Dr Unit 4N
- 9446 Dee Rd Unit 1D
- 9446 Dee Rd Unit 105E
- 9446 Dee Rd Unit 104D
- 9446 Dee Rd Unit 103C
- 9446 Dee Rd Unit 102B
- 9446 Dee Rd Unit 107G
- 9446 Dee Rd Unit 208H
- 9446 Dee Rd Unit 106F
- 9446 Dee Rd Unit 101A
- 9446 Dee Rd Unit 201A
- 9446 Dee Rd Unit 108H
- 9446 Dee Rd Unit 207G
- 9446 Dee Rd Unit 206F
- 9446 Dee Rd Unit 202B
- 9446 Dee Rd Unit 204D
- 9446 Dee Rd Unit 2A
- 9446 Dee Rd Unit 1E
- 9446 Dee Rd Unit 1A
- 9446 Dee Rd Unit 2D
- 9446 Dee Rd Unit 2B
Your Personal Tour Guide
Ask me questions while you tour the home.