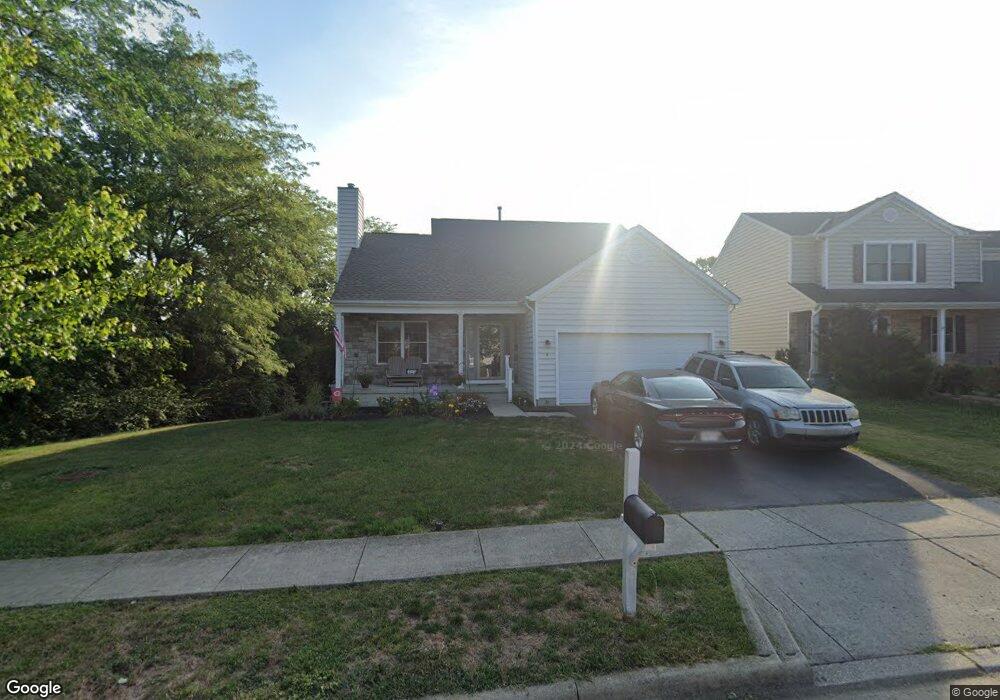
9448 Strawser St Orient, OH 43146
Estimated Value: $348,000 - $384,000
3
Beds
3
Baths
1,752
Sq Ft
$209/Sq Ft
Est. Value
About This Home
This home is located at 9448 Strawser St, Orient, OH 43146 and is currently estimated at $365,313, approximately $208 per square foot. 9448 Strawser St is a home located in Pickaway County.
Ownership History
Date
Name
Owned For
Owner Type
Purchase Details
Closed on
Jun 16, 2021
Sold by
Cox Seth A and Cox Kimberly R
Bought by
Ayers Dianne K and Ayers James M
Current Estimated Value
Home Financials for this Owner
Home Financials are based on the most recent Mortgage that was taken out on this home.
Original Mortgage
$292,940
Outstanding Balance
$265,221
Interest Rate
2.9%
Mortgage Type
Future Advance Clause Open End Mortgage
Estimated Equity
$100,092
Purchase Details
Closed on
Sep 30, 2004
Sold by
Dominion Homes Inc
Bought by
Cox Seth A and Cox Kimberly R
Home Financials for this Owner
Home Financials are based on the most recent Mortgage that was taken out on this home.
Original Mortgage
$205,781
Interest Rate
5.83%
Mortgage Type
FHA
Purchase Details
Closed on
Aug 13, 2004
Sold by
George Terry E
Bought by
Dominion Homes Inc
Home Financials for this Owner
Home Financials are based on the most recent Mortgage that was taken out on this home.
Original Mortgage
$205,781
Interest Rate
5.83%
Mortgage Type
FHA
Create a Home Valuation Report for This Property
The Home Valuation Report is an in-depth analysis detailing your home's value as well as a comparison with similar homes in the area
Home Values in the Area
Average Home Value in this Area
Purchase History
| Date | Buyer | Sale Price | Title Company |
|---|---|---|---|
| Ayers Dianne K | $302,000 | Northwest Advantage Ttl Agcy | |
| Cox Seth A | $208,200 | Alliance Title | |
| Dominion Homes Inc | -- | Alliance Title | |
| George Terry E | -- | Alliance Title |
Source: Public Records
Mortgage History
| Date | Status | Borrower | Loan Amount |
|---|---|---|---|
| Open | Ayers Dianne K | $292,940 | |
| Closed | Cox Seth A | $205,781 |
Source: Public Records
Tax History
| Year | Tax Paid | Tax Assessment Tax Assessment Total Assessment is a certain percentage of the fair market value that is determined by local assessors to be the total taxable value of land and additions on the property. | Land | Improvement |
|---|---|---|---|---|
| 2024 | -- | $103,790 | $10,790 | $93,000 |
| 2023 | $3,904 | $103,790 | $10,790 | $93,000 |
| 2022 | $2,900 | $70,830 | $9,000 | $61,830 |
| 2021 | $2,909 | $70,830 | $9,000 | $61,830 |
| 2020 | $2,910 | $70,830 | $9,000 | $61,830 |
| 2019 | $2,233 | $60,460 | $9,000 | $51,460 |
| 2018 | $2,356 | $60,460 | $9,000 | $51,460 |
| 2017 | $2,418 | $60,460 | $9,000 | $51,460 |
| 2016 | $1,907 | $47,590 | $8,910 | $38,680 |
| 2015 | $1,909 | $47,590 | $8,910 | $38,680 |
| 2014 | $1,911 | $47,590 | $8,910 | $38,680 |
| 2013 | $1,886 | $45,170 | $8,910 | $36,260 |
Source: Public Records
Map
Nearby Homes
- 302 Shady Hollow Dr
- 5640 Freedom Run
- 9174 Constitution Ave
- 297 Mahogany Ln
- 1520 Hiner Rd
- 1490 Hiner Rd
- 1470 Hiner Rd
- 1800 Lynnbrook Ct
- 336 Cherry Hills Rd
- 326 Merion Dr
- 352 Oakmont Dr
- 332 Merion Dr
- Erie Plan at Homes at Foxfire
- Madison Plan at Homes at Foxfire
- Granville Plan at Homes at Foxfire
- Dearborn Plan at Homes at Foxfire
- 444 Bethpage Blvd
- Ashland Plan at Homes at Foxfire
- Hudson Plan at Homes at Foxfire
- Grandview Plan at Homes at Foxfire
- 9450 Strawser St
- 9458 Strawser St
- 9470 Strawser St
- 9470 Strawser St Unit 247
- 9455 Strawser St
- 9445 Strawser St
- 9480 Strawser St
- 9480 Strawser St Unit 248
- 9465 Strawser St
- 5605 Boucher Dr
- 5615 Boucher Dr
- 5575 Boucher Dr
- 5565 Boucher Dr
- 5625 Boucher Dr
- 9475 Strawser St
- 9475 Strawser St Unit 241
- 5557 Boucher Dr
- 9490 Strawser St
- 5560 Dietrich Ave
- 5550 Dietrich Ave
Your Personal Tour Guide
Ask me questions while you tour the home.