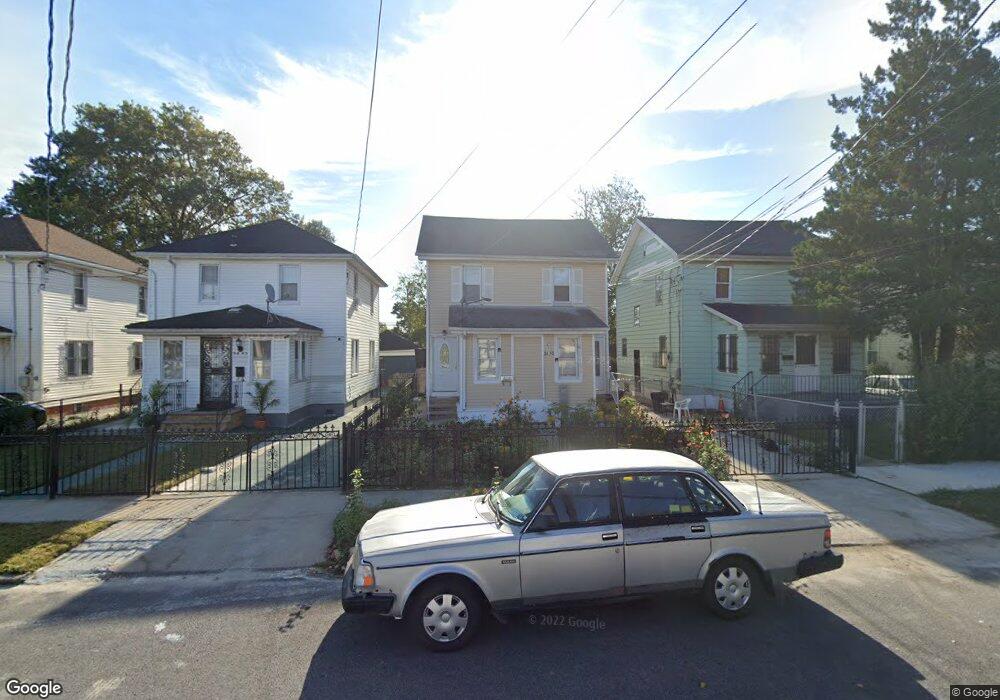
9449 199th St Hollis, NY 11423
Hollis NeighborhoodEstimated Value: $760,318 - $882,000
3
Beds
3
Baths
1,304
Sq Ft
$615/Sq Ft
Est. Value
About This Home
This home is located at 9449 199th St, Hollis, NY 11423 and is currently estimated at $801,580, approximately $614 per square foot. 9449 199th St is a home located in Queens County with nearby schools including P.S. 35 Nathaniel Woodhull, I.S. 238 Susan B Anthony Academy, and Wellspring Elementary & Middle.
Ownership History
Date
Name
Owned For
Owner Type
Purchase Details
Closed on
Jul 2, 2018
Sold by
Singh Sharon
Bought by
Kalicharan Homwattie and Kalicharan Sangeeta
Current Estimated Value
Home Financials for this Owner
Home Financials are based on the most recent Mortgage that was taken out on this home.
Original Mortgage
$568,512
Outstanding Balance
$490,631
Interest Rate
4.5%
Mortgage Type
New Conventional
Estimated Equity
$310,949
Purchase Details
Closed on
Jun 28, 2007
Sold by
Downes Alberto
Bought by
Singh Sharon
Home Financials for this Owner
Home Financials are based on the most recent Mortgage that was taken out on this home.
Original Mortgage
$80,400
Interest Rate
6.48%
Purchase Details
Closed on
Mar 17, 1977
Sold by
Hood Rose E
Bought by
Winn Sybil
Create a Home Valuation Report for This Property
The Home Valuation Report is an in-depth analysis detailing your home's value as well as a comparison with similar homes in the area
Home Values in the Area
Average Home Value in this Area
Purchase History
| Date | Buyer | Sale Price | Title Company |
|---|---|---|---|
| Kalicharan Homwattie | $579,000 | -- | |
| Singh Sharon | $414,460 | -- | |
| Singh Sharon | $414,460 | -- | |
| Winn Sybil | -- | -- | |
| Winn Sybil | -- | -- |
Source: Public Records
Mortgage History
| Date | Status | Borrower | Loan Amount |
|---|---|---|---|
| Open | Kalicharan Homwattie | $568,512 | |
| Previous Owner | Singh Sharon | $80,400 | |
| Previous Owner | Singh Sharon | $321,600 |
Source: Public Records
Tax History Compared to Growth
Tax History
| Year | Tax Paid | Tax Assessment Tax Assessment Total Assessment is a certain percentage of the fair market value that is determined by local assessors to be the total taxable value of land and additions on the property. | Land | Improvement |
|---|---|---|---|---|
| 2025 | $5,375 | $28,363 | $9,492 | $18,871 |
| 2024 | $5,375 | $26,759 | $9,114 | $17,645 |
| 2023 | $5,087 | $25,326 | $8,545 | $16,781 |
| 2022 | $4,055 | $38,580 | $15,000 | $23,580 |
| 2021 | $4,315 | $33,840 | $15,000 | $18,840 |
| 2020 | $4,263 | $35,400 | $15,000 | $20,400 |
| 2019 | $4,665 | $32,820 | $15,000 | $17,820 |
| 2018 | $4,302 | $21,105 | $10,225 | $10,880 |
| 2017 | $4,080 | $20,016 | $11,120 | $8,896 |
| 2016 | $4,001 | $20,016 | $11,120 | $8,896 |
| 2015 | $2,277 | $19,697 | $9,755 | $9,942 |
| 2014 | $2,277 | $18,583 | $10,707 | $7,876 |
Source: Public Records
Map
Nearby Homes
- 94-72 199th St
- 197-31 Carpenter Ave
- 197-21 Carpenter Ave Unit 1G
- 9317 197th St
- 100-32 199th St
- 19611 100th Ave
- 93-17 201st St
- 93-45 202nd St
- 90-35 198th St
- 9302 202nd St
- 9051 201st St
- 92-22 195th Place
- 19515 Woodhull Ave
- 19511 Woodhull Ave
- 104-09 201st St
- 10411 200th St
- 9141 195th St
- 104-28 201st St
- 90-62 204th St
- 10035 204th St