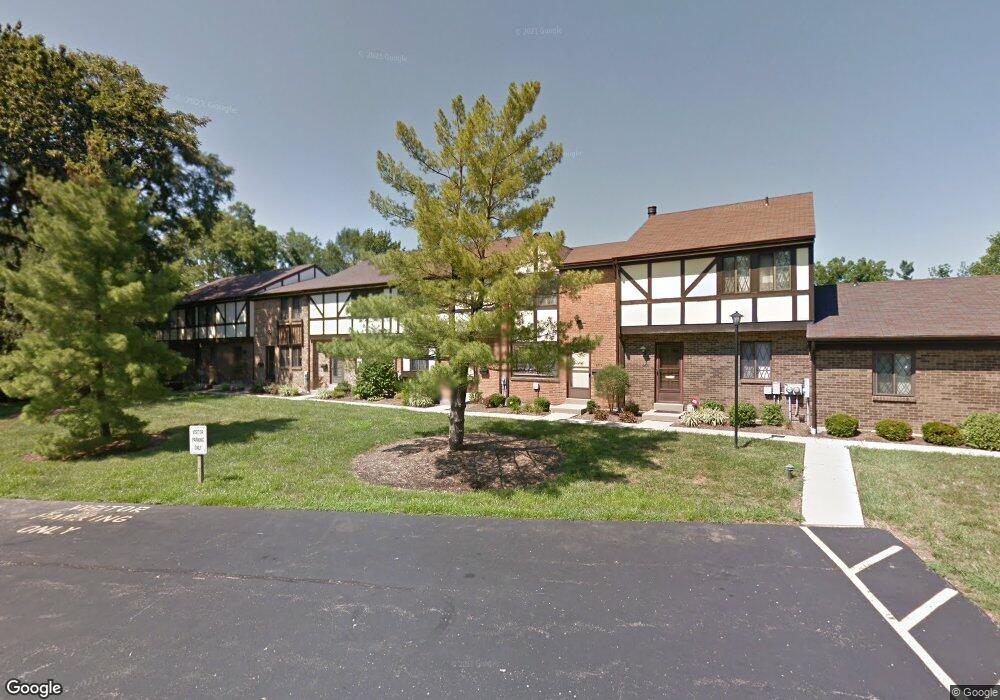
9449 Haddington Ct Unit 223 Cincinnati, OH 45251
Estimated Value: $148,000 - $183,000
3
Beds
3
Baths
1,532
Sq Ft
$108/Sq Ft
Est. Value
About This Home
This home is located at 9449 Haddington Ct Unit 223, Cincinnati, OH 45251 and is currently estimated at $165,175, approximately $107 per square foot. 9449 Haddington Ct Unit 223 is a home located in Hamilton County with nearby schools including Taylor Elementary School, Colerain Elementary School, and Colerain Middle School.
Ownership History
Date
Name
Owned For
Owner Type
Purchase Details
Closed on
Apr 20, 2011
Sold by
Adkins Michael J
Bought by
Fannie Mae and Federal National Mortgage Association
Current Estimated Value
Home Financials for this Owner
Home Financials are based on the most recent Mortgage that was taken out on this home.
Original Mortgage
$38,784
Interest Rate
5.5%
Mortgage Type
FHA
Purchase Details
Closed on
Apr 7, 2011
Sold by
Fannie Mae
Bought by
Schmidt Jennifer
Home Financials for this Owner
Home Financials are based on the most recent Mortgage that was taken out on this home.
Original Mortgage
$38,784
Interest Rate
5.5%
Mortgage Type
FHA
Purchase Details
Closed on
Apr 13, 2007
Sold by
Piepmeier Mark E
Bought by
Adkins Michael J
Home Financials for this Owner
Home Financials are based on the most recent Mortgage that was taken out on this home.
Original Mortgage
$93,500
Interest Rate
6.18%
Mortgage Type
Purchase Money Mortgage
Create a Home Valuation Report for This Property
The Home Valuation Report is an in-depth analysis detailing your home's value as well as a comparison with similar homes in the area
Home Values in the Area
Average Home Value in this Area
Purchase History
| Date | Buyer | Sale Price | Title Company |
|---|---|---|---|
| Fannie Mae | $56,000 | Attorney | |
| Schmidt Jennifer | $48,000 | Prominent Title Agency Llc | |
| Adkins Michael J | $93,500 | Attorney |
Source: Public Records
Mortgage History
| Date | Status | Borrower | Loan Amount |
|---|---|---|---|
| Previous Owner | Schmidt Jennifer | $38,784 | |
| Previous Owner | Adkins Michael J | $93,500 |
Source: Public Records
Tax History Compared to Growth
Tax History
| Year | Tax Paid | Tax Assessment Tax Assessment Total Assessment is a certain percentage of the fair market value that is determined by local assessors to be the total taxable value of land and additions on the property. | Land | Improvement |
|---|---|---|---|---|
| 2024 | $2,530 | $47,408 | $5,950 | $41,458 |
| 2023 | $2,545 | $47,408 | $5,950 | $41,458 |
| 2022 | $1,817 | $27,573 | $3,444 | $24,129 |
| 2021 | $1,801 | $27,573 | $3,444 | $24,129 |
| 2020 | $1,820 | $27,573 | $3,444 | $24,129 |
| 2019 | $1,586 | $22,418 | $2,800 | $19,618 |
| 2018 | $1,423 | $22,418 | $2,800 | $19,618 |
| 2017 | $1,348 | $22,418 | $2,800 | $19,618 |
| 2016 | $690 | $11,260 | $3,168 | $8,092 |
| 2015 | $696 | $11,260 | $3,168 | $8,092 |
| 2014 | $697 | $11,260 | $3,168 | $8,092 |
| 2013 | $988 | $16,800 | $4,725 | $12,075 |
Source: Public Records
Map
Nearby Homes
- 9446 Haddington Ct
- 9558 Woodstate Dr Unit 13E
- 9568 Woodstate Dr
- 3151 Birchway Dr Unit 3151
- 3463 Amberway Ct
- 3258 Lillwood Ln
- 3246 Ainsworth Dr
- 3275 Deshler Dr
- 3351 Deshler Dr
- 3276 Deshler Dr
- 9717 Loralinda Dr
- 9302 Loralinda Dr
- 3205 Donnybrook Ln
- 3119 Deshler Dr
- 9784 Loralinda Dr
- 3013 Niagara St
- 9126 Round Top Rd
- 9125 Round Top Rd
- 9828 Loralinda Dr
- 3545 Alamosa Dr
- 9457 Haddington Ct Unit 227
- 9451 Haddington Ct
- 9453 Haddington Ct
- 9455 Haddington Ct
- 9459 Haddington Ct
- 9433 Haddington Ct Unit 218
- 9431 Haddington Ct
- 9437 Haddington Ct Unit 216
- 9425 Haddington Ct
- 9427 Haddington Ct
- 9435 Haddington Ct
- 9429 Haddington Ct
- 9437 Haddington Ct Unit 221
- 9427 Haddington Ct Unit 221
- 9431 Haddington Ct Unit 219
- 9435 Haddington Ct Unit 217
- 9439 Haddington Ct Unit 215
- 9445 Haddington Ct
- 9447 Haddington Ct
- 9443 Haddington Ct