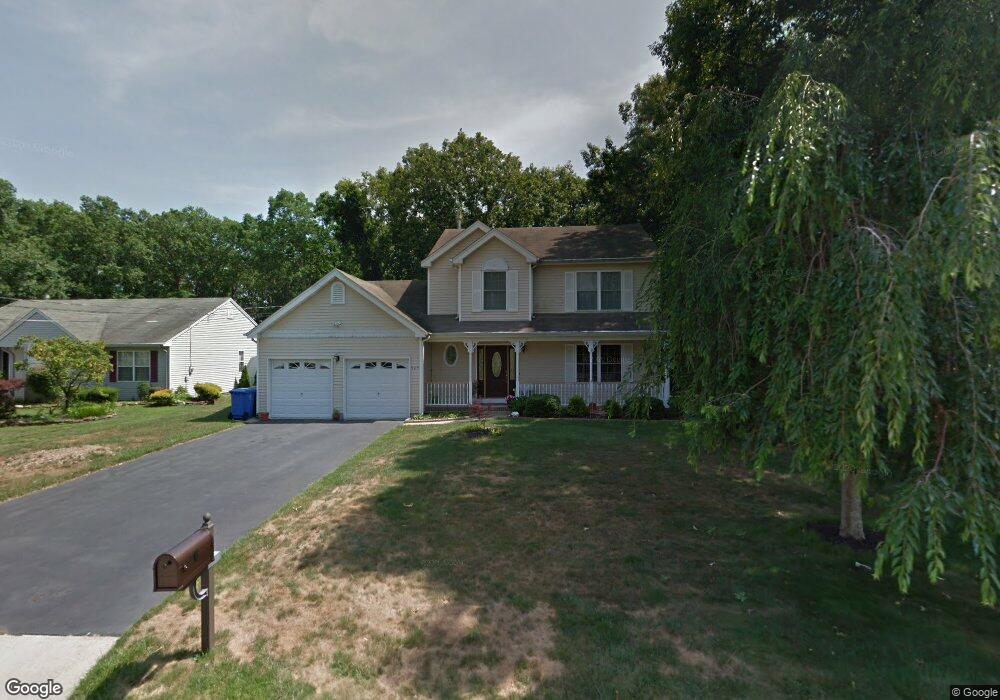
945 Buccaneer Ln Manahawkin, NJ 08050
Stafford NeighborhoodEstimated Value: $573,310 - $609,000
3
Beds
3
Baths
2,004
Sq Ft
$296/Sq Ft
Est. Value
About This Home
This home is located at 945 Buccaneer Ln, Manahawkin, NJ 08050 and is currently estimated at $592,328, approximately $295 per square foot. 945 Buccaneer Ln is a home located in Ocean County with nearby schools including Ocean Acres Elementary School, Oxycocus Elementary School, and McKinley Avenue Elementary School.
Ownership History
Date
Name
Owned For
Owner Type
Purchase Details
Closed on
Dec 27, 2010
Sold by
Smith Darlene and Diodato Darlene A
Bought by
Diodato Darlene A
Current Estimated Value
Home Financials for this Owner
Home Financials are based on the most recent Mortgage that was taken out on this home.
Original Mortgage
$228,000
Outstanding Balance
$83,205
Interest Rate
4.76%
Mortgage Type
New Conventional
Estimated Equity
$509,123
Purchase Details
Closed on
Jun 28, 2004
Sold by
Leeder Donald J and Leeder Eva H
Bought by
Smith Darlene
Home Financials for this Owner
Home Financials are based on the most recent Mortgage that was taken out on this home.
Original Mortgage
$245,000
Interest Rate
6.3%
Mortgage Type
Fannie Mae Freddie Mac
Purchase Details
Closed on
May 14, 1996
Sold by
Accent Homes Inc
Bought by
Leeder Donald J and Leeder Eva H
Home Financials for this Owner
Home Financials are based on the most recent Mortgage that was taken out on this home.
Original Mortgage
$123,000
Interest Rate
7.97%
Create a Home Valuation Report for This Property
The Home Valuation Report is an in-depth analysis detailing your home's value as well as a comparison with similar homes in the area
Home Values in the Area
Average Home Value in this Area
Purchase History
| Date | Buyer | Sale Price | Title Company |
|---|---|---|---|
| Diodato Darlene A | -- | None Available | |
| Smith Darlene | $345,000 | Lawyers Title Insurance Corp | |
| Leeder Donald J | $177,937 | -- |
Source: Public Records
Mortgage History
| Date | Status | Borrower | Loan Amount |
|---|---|---|---|
| Open | Diodato Darlene A | $228,000 | |
| Closed | Smith Darlene | $245,000 | |
| Previous Owner | Leeder Donald J | $123,000 |
Source: Public Records
Tax History Compared to Growth
Tax History
| Year | Tax Paid | Tax Assessment Tax Assessment Total Assessment is a certain percentage of the fair market value that is determined by local assessors to be the total taxable value of land and additions on the property. | Land | Improvement |
|---|---|---|---|---|
| 2025 | $6,739 | $271,400 | $75,100 | $196,300 |
| 2024 | $6,674 | $271,400 | $75,100 | $196,300 |
| 2023 | $6,389 | $271,400 | $75,100 | $196,300 |
| 2022 | $6,389 | $271,400 | $75,100 | $196,300 |
| 2021 | $6,302 | $271,400 | $75,100 | $196,300 |
| 2020 | $6,310 | $271,400 | $75,100 | $196,300 |
| 2019 | $6,220 | $271,400 | $75,100 | $196,300 |
| 2018 | $6,182 | $271,400 | $75,100 | $196,300 |
| 2017 | $6,250 | $265,600 | $75,100 | $190,500 |
| 2016 | $6,186 | $265,600 | $75,100 | $190,500 |
| 2015 | $5,968 | $265,600 | $75,100 | $190,500 |
| 2014 | $5,867 | $257,900 | $74,100 | $183,800 |
Source: Public Records
Map
Nearby Homes
- 909 Bonita Ln
- 1034 Buccaneer Ln
- 217 Middie Ln
- 220 Middie Ln
- 200 Cutter Ln
- 223 Serpent Ln
- 55 Holloway Ave
- 0 Levi Rd Unit NJOC2030756
- 0 Levi's Rd
- 208 Steering Ln
- 1073 Cutlass Ave
- 296 Nautilus Dr
- 126 Trim Ln
- 372 Nautilus Dr
- 121 Trim Ln
- 1014 Clearwater Ave
- 4 Fair Oaks Dr
- 274 Beachview Ave
- 248 Matey Ave
- 121 Reel Ave
- 941 Buccaneer Ln
- 949 Buccaneer Ln
- 953 Buccaneer Ln
- 937 Buccaneer Ln
- 944 Buccaneer Ln
- 948 Buccaneer Ln
- 940 Buccaneer Ln
- 957 Buccaneer Ln
- 933 Buccaneer Ln
- 936 Buccaneer Ln
- 468 Pirate Ln
- 945 Painter Ln
- 949 Painter Ln
- 932 Buccaneer Ln
- 941 Painter Ln
- 937 Painter Ln
- 476 Pirate Ln
- 956 Buccaneer Ln
- 965 Buccaneer Ln
- 928 Buccaneer Ln