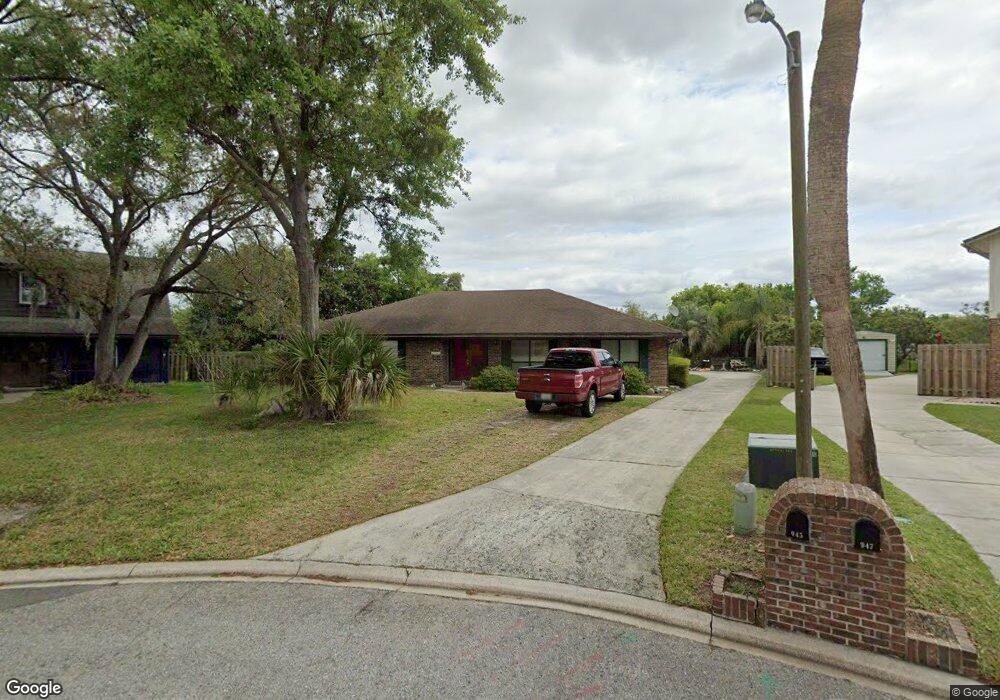
945 Cedar Ridge Ct Orange Park, FL 32065
Estimated Value: $400,000 - $444,000
4
Beds
2
Baths
2,411
Sq Ft
$171/Sq Ft
Est. Value
About This Home
This home is located at 945 Cedar Ridge Ct, Orange Park, FL 32065 and is currently estimated at $412,927, approximately $171 per square foot. 945 Cedar Ridge Ct is a home located in Clay County with nearby schools including Ridgeview Elementary School, Ridgeview High School, and Orange Park Junior High School.
Ownership History
Date
Name
Owned For
Owner Type
Purchase Details
Closed on
Aug 26, 2020
Sold by
Moore Tommy L and Moore Charlotte
Bought by
Moore Tommy L and Moore Charlotte
Current Estimated Value
Home Financials for this Owner
Home Financials are based on the most recent Mortgage that was taken out on this home.
Original Mortgage
$270,847
Outstanding Balance
$240,359
Interest Rate
2.9%
Mortgage Type
VA
Estimated Equity
$172,568
Purchase Details
Closed on
Jul 3, 2019
Sold by
Parham Benjamin A and Parham Nicole M
Bought by
Moore Tommy L and Moore Charlotte
Home Financials for this Owner
Home Financials are based on the most recent Mortgage that was taken out on this home.
Original Mortgage
$263,415
Interest Rate
3.9%
Mortgage Type
VA
Purchase Details
Closed on
Jun 4, 2007
Sold by
Melton Thleia D and Melton Jerry L
Bought by
Parham Benjamin A and Parham Nicole M
Home Financials for this Owner
Home Financials are based on the most recent Mortgage that was taken out on this home.
Original Mortgage
$260,000
Interest Rate
7.87%
Mortgage Type
Purchase Money Mortgage
Purchase Details
Closed on
Jul 30, 2004
Sold by
Melton Jerry L
Bought by
Melton Thleia D
Create a Home Valuation Report for This Property
The Home Valuation Report is an in-depth analysis detailing your home's value as well as a comparison with similar homes in the area
Home Values in the Area
Average Home Value in this Area
Purchase History
| Date | Buyer | Sale Price | Title Company |
|---|---|---|---|
| Moore Tommy L | -- | Clientfirst Title Llc | |
| Moore Tommy L | $255,000 | Attorney | |
| Parham Benjamin A | $260,000 | Security Title Agency Inc | |
| Melton Thleia D | $500 | -- |
Source: Public Records
Mortgage History
| Date | Status | Borrower | Loan Amount |
|---|---|---|---|
| Open | Moore Tommy L | $270,847 | |
| Closed | Moore Tommy L | $263,415 | |
| Previous Owner | Parham Benjamin A | $260,000 |
Source: Public Records
Tax History Compared to Growth
Tax History
| Year | Tax Paid | Tax Assessment Tax Assessment Total Assessment is a certain percentage of the fair market value that is determined by local assessors to be the total taxable value of land and additions on the property. | Land | Improvement |
|---|---|---|---|---|
| 2024 | $3,222 | $237,201 | -- | -- |
| 2023 | $3,222 | $230,293 | $0 | $0 |
| 2022 | $3,012 | $223,586 | $0 | $0 |
| 2021 | $2,998 | $217,074 | $0 | $0 |
| 2020 | $2,896 | $214,077 | $30,000 | $184,077 |
| 2019 | $3,376 | $204,677 | $30,000 | $174,677 |
| 2018 | $3,126 | $200,894 | $0 | $0 |
| 2017 | $2,909 | $182,294 | $0 | $0 |
| 2016 | $2,719 | $165,488 | $0 | $0 |
| 2015 | $2,694 | $158,514 | $0 | $0 |
| 2014 | $1,734 | $153,645 | $0 | $0 |
Source: Public Records
Map
Nearby Homes
- 2911 Circle Ridge Dr
- 2894 Circle Ridge Dr
- 2822 Circle Ridge Dr
- 807 Elmwood St
- 2409 Balsamwood Ct
- 755 Sandlewood Dr
- 2477 Ridgecrest Ave
- 958 Sweetwood Ct
- 2300 Twelve Oaks Dr Unit J6
- 2300 Twelve Oaks Dr Unit B4
- 2300 Twelve Oaks Dr Unit A-5
- 592 Charles Pinckney St
- 603 Benjamin Harrison St
- 2376 Kirkwall St
- 1064 Rene Ct
- 590 Constitution Dr
- 644 Charles Carroll St
- 3068 Moody Ave
- 2527 Bottomridge Dr
- 1179 Kincross Ct
- 947 Cedar Ridge Ct
- 944 Cedar Ridge Ct
- 949 Cedar Ridge Ct
- 948 Cedar Ridge Ct
- 2889 Circle Ridge Dr
- 2891 Circle Ridge Dr
- 2885 Circle Ridge Dr
- 947 Maple Ridge Ct
- 949 Maple Ridge Ct
- 2893 Circle Ridge Dr
- 2837 Circle Ridge Dr
- 2835 Circle Ridge Dr
- 2839 Circle Ridge Dr
- 2829 Circle Ridge Dr
- 951 Maple Ridge Ct
- 944 Maple Ridge Ct
- 2831 Circle Ridge Dr
- 2827 Circle Ridge Dr
- 2895 Circle Ridge Dr
- 2841 Circle Ridge Dr