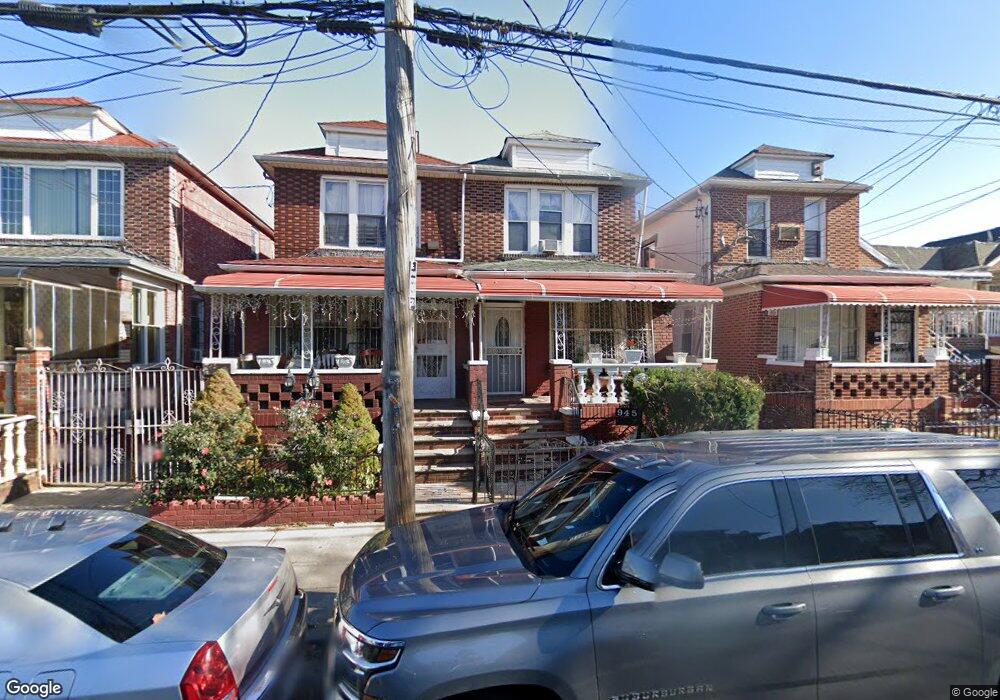
945 E 48th St Brooklyn, NY 11203
East Flatbush NeighborhoodEstimated Value: $749,000 - $933,481
Studio
--
Bath
1,648
Sq Ft
$509/Sq Ft
Est. Value
About This Home
This home is located at 945 E 48th St, Brooklyn, NY 11203 and is currently estimated at $838,620, approximately $508 per square foot. 945 E 48th St is a home located in Kings County with nearby schools including P.S. 208 Elsa Ebeling, I.S. 285 Meyer Levin, and Ivy Hill Preparatory Charter School.
Ownership History
Date
Name
Owned For
Owner Type
Purchase Details
Closed on
Nov 24, 2010
Sold by
Dure Carline and Dure Myrianne
Bought by
Dure Myrianne
Current Estimated Value
Home Financials for this Owner
Home Financials are based on the most recent Mortgage that was taken out on this home.
Original Mortgage
$393,193
Outstanding Balance
$257,079
Interest Rate
4.17%
Mortgage Type
Purchase Money Mortgage
Estimated Equity
$581,541
Purchase Details
Closed on
Dec 24, 2003
Sold by
Worthy Jannie
Bought by
Dure Carline and Dure Myrianne
Home Financials for this Owner
Home Financials are based on the most recent Mortgage that was taken out on this home.
Original Mortgage
$275,000
Interest Rate
5.71%
Mortgage Type
Purchase Money Mortgage
Purchase Details
Closed on
Mar 5, 1999
Sold by
Worthy Jannie
Bought by
Worthy Jannie
Create a Home Valuation Report for This Property
The Home Valuation Report is an in-depth analysis detailing your home's value as well as a comparison with similar homes in the area
Home Values in the Area
Average Home Value in this Area
Purchase History
| Date | Buyer | Sale Price | Title Company |
|---|---|---|---|
| Dure Myrianne | -- | -- | |
| Dure Myrianne | -- | -- | |
| Dure Carline | $285,000 | -- | |
| Dure Carline | $285,000 | -- | |
| Worthy Jannie | -- | Commonwealth Land Title Ins | |
| Worthy Jannie | -- | Commonwealth Land Title Ins |
Source: Public Records
Mortgage History
| Date | Status | Borrower | Loan Amount |
|---|---|---|---|
| Open | Dure Myrianne | $393,193 | |
| Closed | Dure Myrianne | $393,193 | |
| Previous Owner | Dure Carline | $275,000 |
Source: Public Records
Tax History
| Year | Tax Paid | Tax Assessment Tax Assessment Total Assessment is a certain percentage of the fair market value that is determined by local assessors to be the total taxable value of land and additions on the property. | Land | Improvement |
|---|---|---|---|---|
| 2025 | $6,558 | $40,920 | $15,600 | $25,320 |
| 2024 | $6,558 | $44,880 | $15,600 | $29,280 |
| 2023 | $6,256 | $45,900 | $15,600 | $30,300 |
| 2022 | $5,802 | $45,180 | $15,600 | $29,580 |
| 2021 | $6,116 | $43,860 | $15,600 | $28,260 |
| 2020 | $2,999 | $31,800 | $15,600 | $16,200 |
| 2019 | $5,692 | $31,800 | $15,600 | $16,200 |
| 2018 | $5,233 | $25,670 | $12,545 | $13,125 |
| 2017 | $4,937 | $24,218 | $13,808 | $10,410 |
| 2016 | $4,841 | $24,218 | $14,343 | $9,875 |
| 2015 | $2,536 | $23,886 | $14,002 | $9,884 |
| 2014 | $2,536 | $22,674 | $13,158 | $9,516 |
Source: Public Records
Map
Nearby Homes
Your Personal Tour Guide
Ask me questions while you tour the home.