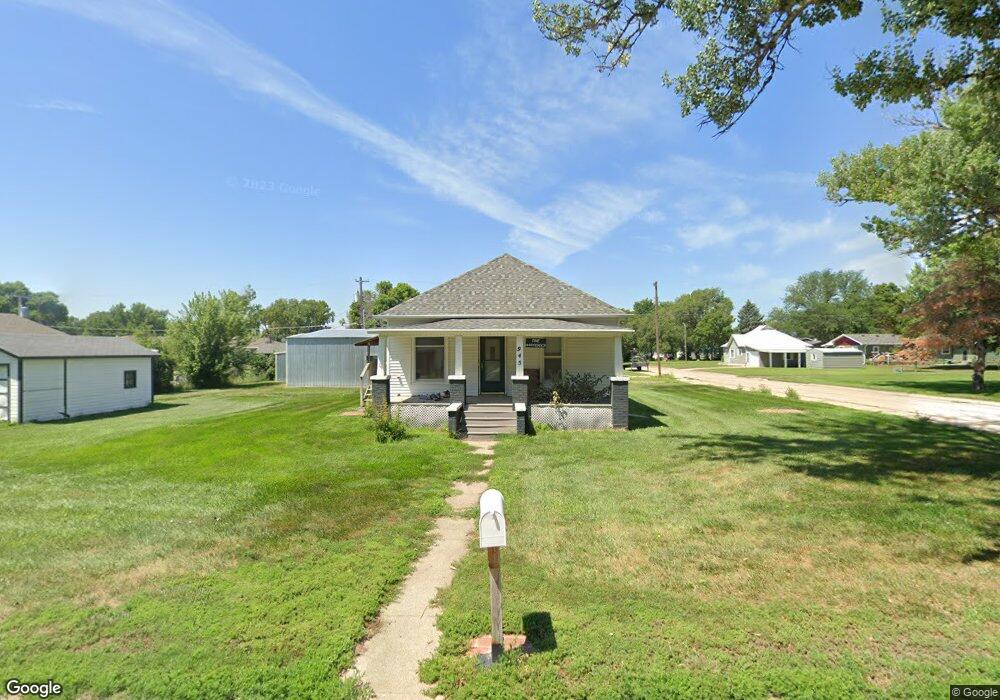
945 N 13th Ave Broken Bow, NE 68822
Estimated Value: $125,000 - $141,000
2
Beds
1
Bath
1,014
Sq Ft
$132/Sq Ft
Est. Value
About This Home
This home is located at 945 N 13th Ave, Broken Bow, NE 68822 and is currently estimated at $133,718, approximately $131 per square foot. 945 N 13th Ave is a home located in Custer County with nearby schools including North Park Elementary School, Broken Bow Junior High School, and Broken Bow High School.
Ownership History
Date
Name
Owned For
Owner Type
Purchase Details
Closed on
Nov 20, 2020
Sold by
Charles Sargent Irrigation Inc
Bought by
Merrick Whitesel
Current Estimated Value
Purchase Details
Closed on
Sep 14, 2015
Sold by
Hunsberger Rentals Llc
Bought by
Charles Sargent Inc
Purchase Details
Closed on
Jan 31, 2011
Sold by
Hunsberger Mike and Hunsberger Maureen
Bought by
Hunsberger Rentals Llc
Purchase Details
Closed on
Sep 28, 2010
Sold by
Sec Of Housing & Urban Dev
Bought by
Hunsberger Mike and Hunsberger Maureen
Purchase Details
Closed on
Jul 13, 2009
Sold by
Wells Fargo Bank Na
Bought by
Sec Of Housing & Urban Dev
Create a Home Valuation Report for This Property
The Home Valuation Report is an in-depth analysis detailing your home's value as well as a comparison with similar homes in the area
Home Values in the Area
Average Home Value in this Area
Purchase History
| Date | Buyer | Sale Price | Title Company |
|---|---|---|---|
| Merrick Whitesel | $80,000 | -- | |
| Charles Sargent Inc | $79,000 | -- | |
| Hunsberger Rentals Llc | -- | -- | |
| Hunsberger Mike | $25,000 | -- | |
| Sec Of Housing & Urban Dev | $34,700 | -- | |
| Wells Fargo Bank Na | $34,700 | -- |
Source: Public Records
Tax History Compared to Growth
Tax History
| Year | Tax Paid | Tax Assessment Tax Assessment Total Assessment is a certain percentage of the fair market value that is determined by local assessors to be the total taxable value of land and additions on the property. | Land | Improvement |
|---|---|---|---|---|
| 2025 | $1,282 | $107,472 | $18,739 | $88,733 |
| 2024 | $1,282 | $95,214 | $18,739 | $76,475 |
| 2023 | $1,505 | $96,052 | $18,739 | $77,313 |
| 2022 | $1,601 | $87,213 | $18,739 | $68,474 |
| 2021 | $1,543 | $86,042 | $17,568 | $68,474 |
| 2020 | $1,416 | $79,622 | $17,568 | $62,054 |
| 2019 | $1,294 | $72,870 | $8,784 | $64,086 |
| 2017 | $1,266 | $69,318 | $8,784 | $60,534 |
| 2016 | $1,317 | $65,922 | $5,388 | $60,534 |
| 2015 | $866 | $42,986 | $5,280 | $37,706 |
| 2014 | $866 | $39,078 | $4,800 | $34,278 |
Source: Public Records
Map
Nearby Homes