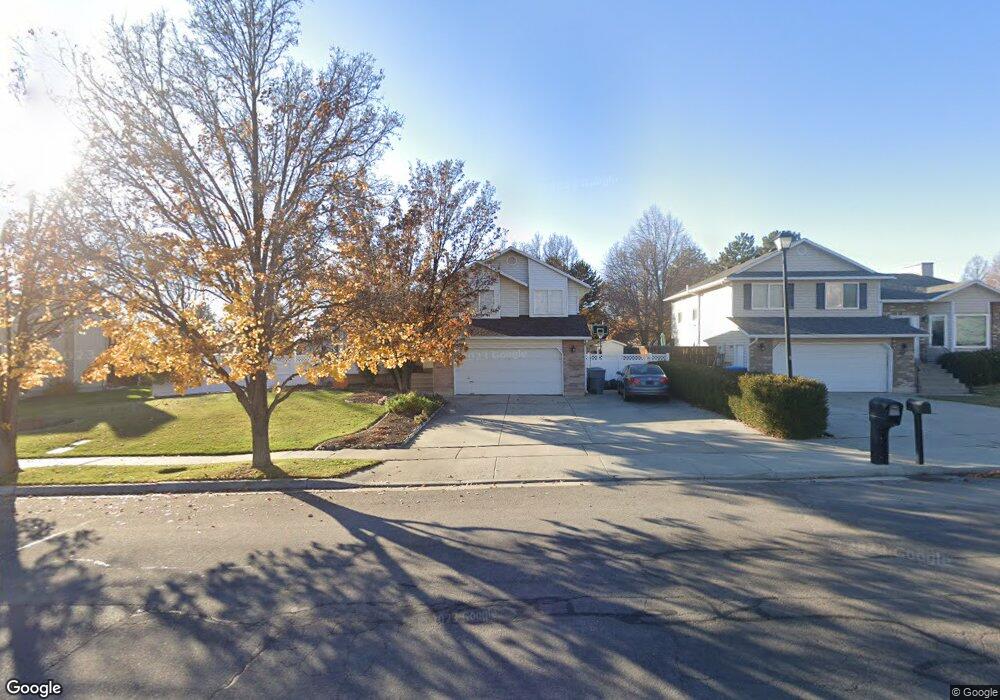
945 N 350 W American Fork, UT 84003
Estimated Value: $583,162 - $615,000
5
Beds
3
Baths
2,432
Sq Ft
$245/Sq Ft
Est. Value
About This Home
This home is located at 945 N 350 W, American Fork, UT 84003 and is currently estimated at $596,041, approximately $245 per square foot. 945 N 350 W is a home located in Utah County with nearby schools including Shelley Elementary School, American Fork Junior High School, and American Fork High School.
Ownership History
Date
Name
Owned For
Owner Type
Purchase Details
Closed on
Jan 24, 2007
Sold by
Poulson Jerald F and Poulson Jenene
Bought by
Poulson Michael J and Poulson Raylyn T
Current Estimated Value
Home Financials for this Owner
Home Financials are based on the most recent Mortgage that was taken out on this home.
Original Mortgage
$207,000
Outstanding Balance
$123,013
Interest Rate
6.11%
Mortgage Type
Purchase Money Mortgage
Estimated Equity
$473,028
Purchase Details
Closed on
Sep 9, 1998
Sold by
Peck Ted and Peck Debra
Bought by
Poulson Jerald F and Poulson Jenene F
Home Financials for this Owner
Home Financials are based on the most recent Mortgage that was taken out on this home.
Original Mortgage
$110,000
Interest Rate
6.92%
Purchase Details
Closed on
Aug 8, 1997
Sold by
Pulham Brian K and Pulham Robyn K
Bought by
Peck Ted and Peck Debra
Home Financials for this Owner
Home Financials are based on the most recent Mortgage that was taken out on this home.
Original Mortgage
$136,000
Interest Rate
7.57%
Create a Home Valuation Report for This Property
The Home Valuation Report is an in-depth analysis detailing your home's value as well as a comparison with similar homes in the area
Home Values in the Area
Average Home Value in this Area
Purchase History
| Date | Buyer | Sale Price | Title Company |
|---|---|---|---|
| Poulson Michael J | -- | Metro National Title Orem | |
| Poulson Jerald F | -- | Superior Title Company | |
| Peck Ted | -- | -- |
Source: Public Records
Mortgage History
| Date | Status | Borrower | Loan Amount |
|---|---|---|---|
| Open | Poulson Michael J | $207,000 | |
| Previous Owner | Poulson Jerald F | $110,000 | |
| Previous Owner | Peck Ted | $136,000 |
Source: Public Records
Tax History Compared to Growth
Tax History
| Year | Tax Paid | Tax Assessment Tax Assessment Total Assessment is a certain percentage of the fair market value that is determined by local assessors to be the total taxable value of land and additions on the property. | Land | Improvement |
|---|---|---|---|---|
| 2025 | $2,383 | $281,820 | $220,700 | $291,700 |
| 2024 | $2,383 | $264,825 | $0 | $0 |
| 2023 | $2,286 | $269,335 | $0 | $0 |
| 2022 | $2,366 | $275,000 | $0 | $0 |
| 2021 | $2,024 | $367,600 | $158,400 | $209,200 |
| 2020 | $1,893 | $333,300 | $141,400 | $191,900 |
| 2019 | $1,709 | $311,200 | $130,800 | $180,400 |
| 2018 | $1,612 | $280,700 | $123,800 | $156,900 |
| 2017 | $1,535 | $144,320 | $0 | $0 |
| 2016 | $1,471 | $128,425 | $0 | $0 |
| 2015 | $1,409 | $116,765 | $0 | $0 |
| 2014 | $1,399 | $114,400 | $0 | $0 |
Source: Public Records
Map
Nearby Homes
- 3889 W 950 Cir N Unit 366
- 914 N 400 W Unit A
- 987 N 410 W
- 984 N 300 W
- 471 W 1040 N
- 344 W 1080 N
- 425 W 1120 N
- 796 N 200 W
- 602 W 860 N
- 782 N 200 W
- 641 N 420 W
- 10238 N 6530 W Unit 15
- 5284 N 11200 W Unit 3
- 1051 N 390 E Unit 103
- 6079 W Whisper Ln Unit 404
- 1220 E 700 N
- 1039 N 390 E Unit 102
- 11338 N Annes Way Unit 8
- 6111 W Whisper Ln Unit 402
- 5277 N 11200 W Unit 4
- 3796 W 950 Cir N Unit 374
- 923 N 350 W
- 967 N 350 W
- 962 N 350 W
- 349 W 950 N
- 911 N 350 W
- 979 N 350 W
- 978 N 350 W
- 960 N 400 W
- 914 N 400 W
- 914 N 400 W Unit C
- 914 N 400 W Unit B
- 982 N 400 W Unit B
- 982 N 400 W Unit C
- 982 N 400 W Unit 13
- 982 N 400 W Unit A
- 342 W 900 N
- 337 W 950 N
- 978 N 400 W Unit C
- 978 N 400 W