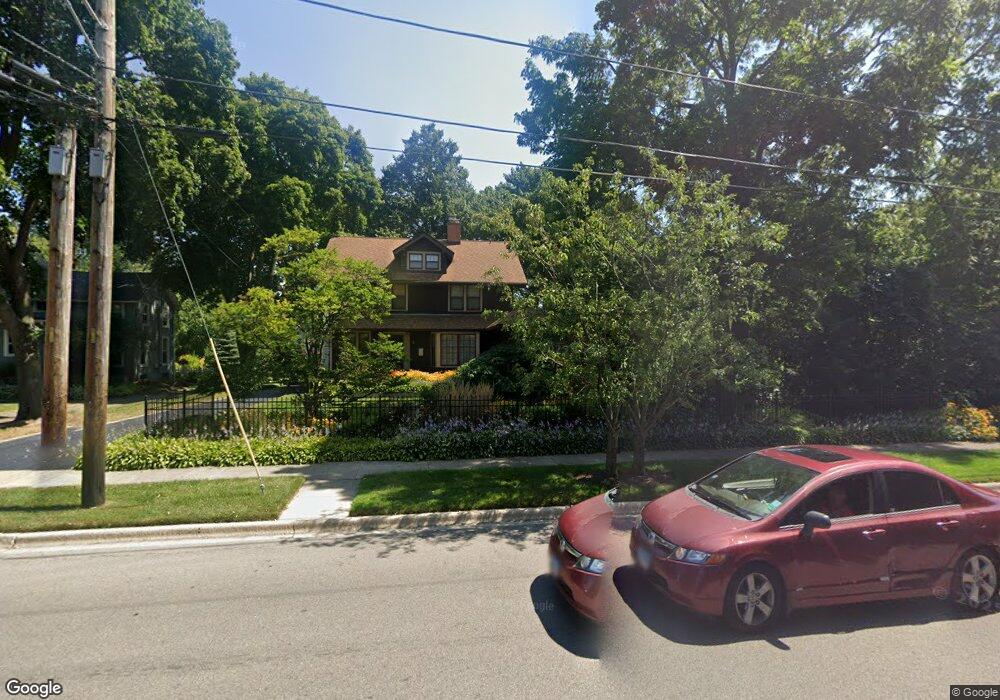
945 N Sheridan Rd Waukegan, IL 60085
Estimated Value: $344,000 - $373,000
4
Beds
3
Baths
2,800
Sq Ft
$129/Sq Ft
Est. Value
About This Home
This home is located at 945 N Sheridan Rd, Waukegan, IL 60085 and is currently estimated at $361,746, approximately $129 per square foot. 945 N Sheridan Rd is a home located in Lake County with nearby schools including Edith M Smith Middle School, Waukegan High School, and LEARN John & Kathy Schreiber Campus.
Ownership History
Date
Name
Owned For
Owner Type
Purchase Details
Closed on
May 14, 2020
Sold by
Trigg Michael J and Trigg Paula J
Bought by
Trigg Michael J and Trigg Paula J
Current Estimated Value
Purchase Details
Closed on
Sep 30, 1996
Sold by
Keller Ronald F and Hardy Dwight J
Bought by
Trigg Michael J and Trigg Paula J
Home Financials for this Owner
Home Financials are based on the most recent Mortgage that was taken out on this home.
Original Mortgage
$207,000
Outstanding Balance
$18,804
Interest Rate
7.97%
Estimated Equity
$342,942
Purchase Details
Closed on
Nov 22, 1993
Sold by
Williamson Michael J and Williamson Charleen N
Bought by
Hardy Dwight J and Keller Ronald F
Home Financials for this Owner
Home Financials are based on the most recent Mortgage that was taken out on this home.
Original Mortgage
$175,500
Interest Rate
6.92%
Create a Home Valuation Report for This Property
The Home Valuation Report is an in-depth analysis detailing your home's value as well as a comparison with similar homes in the area
Home Values in the Area
Average Home Value in this Area
Purchase History
| Date | Buyer | Sale Price | Title Company |
|---|---|---|---|
| Trigg Michael J | -- | Attorney | |
| Trigg Michael J | $240,000 | -- | |
| Hardy Dwight J | $130,000 | -- |
Source: Public Records
Mortgage History
| Date | Status | Borrower | Loan Amount |
|---|---|---|---|
| Open | Trigg Michael J | $207,000 | |
| Previous Owner | Hardy Dwight J | $175,500 |
Source: Public Records
Tax History Compared to Growth
Tax History
| Year | Tax Paid | Tax Assessment Tax Assessment Total Assessment is a certain percentage of the fair market value that is determined by local assessors to be the total taxable value of land and additions on the property. | Land | Improvement |
|---|---|---|---|---|
| 2024 | $8,400 | $107,450 | $17,493 | $89,957 |
| 2023 | $9,405 | $97,083 | $15,805 | $81,278 |
| 2022 | $9,405 | $102,205 | $22,635 | $79,570 |
| 2021 | $9,320 | $95,399 | $20,140 | $75,259 |
| 2020 | $9,395 | $88,876 | $18,763 | $70,113 |
| 2019 | $9,402 | $81,440 | $17,193 | $64,247 |
| 2018 | $9,219 | $77,690 | $20,857 | $56,833 |
| 2017 | $8,924 | $68,734 | $18,453 | $50,281 |
| 2016 | $8,303 | $59,727 | $16,035 | $43,692 |
| 2015 | $8,017 | $53,457 | $14,352 | $39,105 |
| 2014 | $7,658 | $50,803 | $10,859 | $39,944 |
| 2012 | $9,511 | $55,040 | $11,765 | $43,275 |
Source: Public Records
Map
Nearby Homes
- 415 W Ridgeland Ave
- 723 N County St
- 611 N Genesee St
- 325 4th St
- 1110 N Ash St
- 918 N Ash St
- 1122 N Ash St
- 452 North Ave
- 1336 N Ash St
- 620 N Poplar St
- 702 Franklin St
- 1335 Chestnut St
- 522 N Poplar St
- 222 Grand Ave
- 1613 North Ave
- 428 N Poplar St
- 511 Chestnut St
- 917 N Linden Ave
- 616 W Keith Ave
- 1109 Massena Ave
- 1001 N Sheridan Rd Unit 1001
- 1001 N Sheridan Rd
- 1009 N Sheridan Rd
- 936 N Sheridan Rd
- 946 N Sheridan Rd
- 946 N Sheridan Rd
- 1004 N Sheridan Rd
- 927 N Sheridan Rd
- 1032 N Sheridan Rd Unit 1B
- 1011 N Sheridan Rd
- 1008 N Sheridan Rd
- 926 N Sheridan Rd
- 1021 N Sheridan Rd
- 216 W Ridgeland Ave
- 915 N Sheridan Rd
- 922 N Sheridan Rd
- 1018 N Sheridan Rd
- 220 W Ridgeland Ave
- 221 W Ridgeland Ave
- 918 N Sheridan Rd