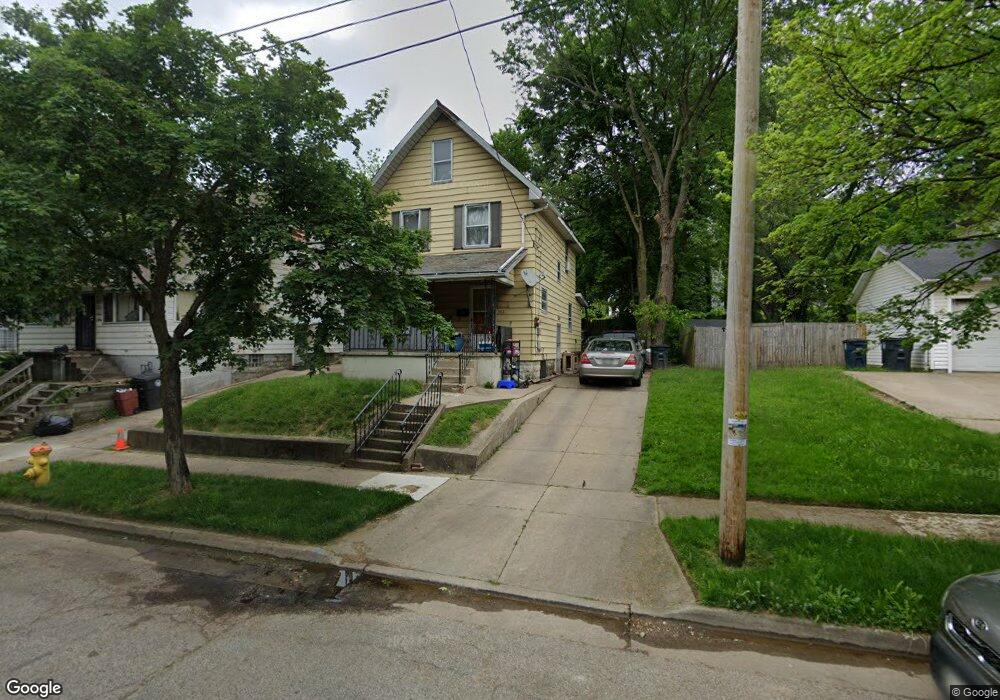
945 Penn Ave Akron, OH 44311
Summit Lake NeighborhoodEstimated Value: $62,000 - $80,000
3
Beds
1
Bath
1,064
Sq Ft
$66/Sq Ft
Est. Value
About This Home
This home is located at 945 Penn Ave, Akron, OH 44311 and is currently estimated at $69,800, approximately $65 per square foot. 945 Penn Ave is a home located in Summit County with nearby schools including North High School, Main Preparatory Academy, and St. Bernard-St. Mary Elementary School.
Ownership History
Date
Name
Owned For
Owner Type
Purchase Details
Closed on
May 11, 2015
Sold by
Harper Harold H and Harper Carol J
Bought by
Bell Shetoria Leonda
Current Estimated Value
Home Financials for this Owner
Home Financials are based on the most recent Mortgage that was taken out on this home.
Original Mortgage
$33,850
Interest Rate
5%
Mortgage Type
Seller Take Back
Purchase Details
Closed on
Sep 30, 1998
Sold by
Thomas James C
Bought by
Harper Harold H and Harper Carol J
Create a Home Valuation Report for This Property
The Home Valuation Report is an in-depth analysis detailing your home's value as well as a comparison with similar homes in the area
Home Values in the Area
Average Home Value in this Area
Purchase History
| Date | Buyer | Sale Price | Title Company |
|---|---|---|---|
| Bell Shetoria Leonda | $33,850 | None Available | |
| Harper Harold H | $10,000 | -- |
Source: Public Records
Mortgage History
| Date | Status | Borrower | Loan Amount |
|---|---|---|---|
| Closed | Bell Shetoria Leonda | $33,850 |
Source: Public Records
Tax History Compared to Growth
Tax History
| Year | Tax Paid | Tax Assessment Tax Assessment Total Assessment is a certain percentage of the fair market value that is determined by local assessors to be the total taxable value of land and additions on the property. | Land | Improvement |
|---|---|---|---|---|
| 2025 | $602 | $10,017 | $3,283 | $6,734 |
| 2024 | $602 | $10,017 | $3,283 | $6,734 |
| 2023 | $602 | $10,017 | $3,283 | $6,734 |
| 2022 | $469 | $5,894 | $1,932 | $3,962 |
| 2021 | $470 | $5,894 | $1,932 | $3,962 |
| 2020 | $464 | $5,890 | $1,930 | $3,960 |
| 2019 | $586 | $7,040 | $2,320 | $4,720 |
| 2018 | $579 | $7,040 | $2,320 | $4,720 |
| 2017 | $597 | $7,040 | $2,320 | $4,720 |
| 2016 | $598 | $7,170 | $2,320 | $4,850 |
| 2015 | $597 | $7,170 | $2,320 | $4,850 |
| 2014 | $593 | $7,170 | $2,320 | $4,850 |
| 2013 | $625 | $7,780 | $2,320 | $5,460 |
Source: Public Records
Map
Nearby Homes