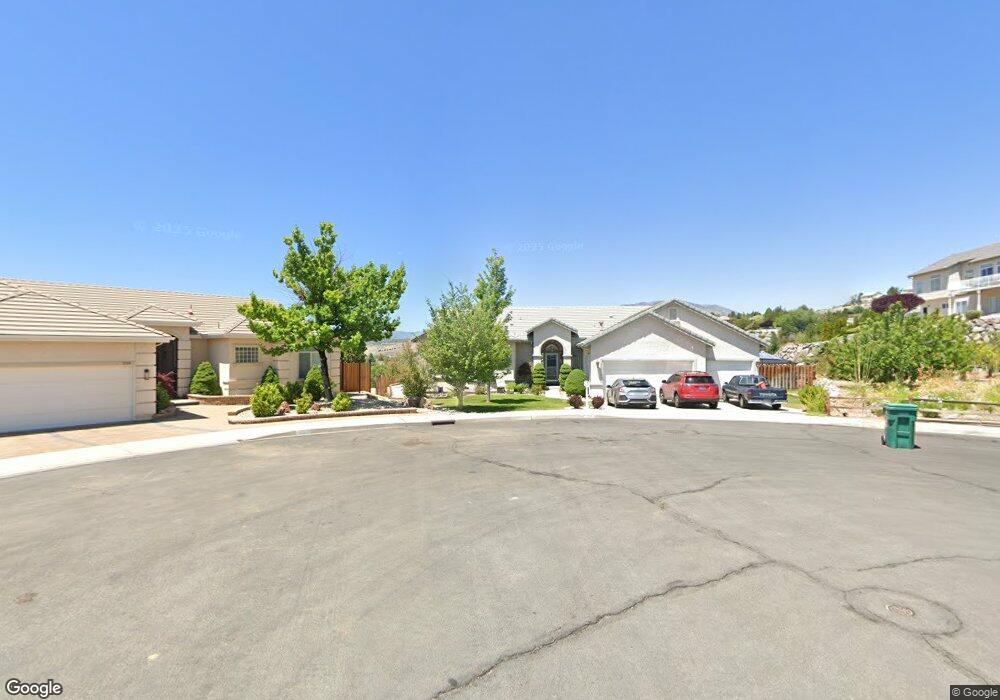
945 Stadium View Ct Reno, NV 89512
West University NeighborhoodEstimated Value: $684,796 - $823,000
4
Beds
3
Baths
2,547
Sq Ft
$297/Sq Ft
Est. Value
About This Home
This home is located at 945 Stadium View Ct, Reno, NV 89512 and is currently estimated at $756,449, approximately $296 per square foot. 945 Stadium View Ct is a home located in Washoe County with nearby schools including Peavine Elementary School, Archie Clayton Pre-AP Academy, and Coral Academy Charter School Elementary.
Ownership History
Date
Name
Owned For
Owner Type
Purchase Details
Closed on
Apr 9, 2004
Sold by
Williams Oliver B and Williams Irmgard
Bought by
Rusk Daniel D and Rusk Luz Amanda
Current Estimated Value
Home Financials for this Owner
Home Financials are based on the most recent Mortgage that was taken out on this home.
Original Mortgage
$99,750
Outstanding Balance
$45,924
Interest Rate
5.35%
Mortgage Type
Unknown
Estimated Equity
$710,525
Purchase Details
Closed on
May 3, 2000
Sold by
Highlands Communities Llc
Bought by
Williams Oliver B and Williams Irmgard
Home Financials for this Owner
Home Financials are based on the most recent Mortgage that was taken out on this home.
Original Mortgage
$171,000
Interest Rate
9.12%
Create a Home Valuation Report for This Property
The Home Valuation Report is an in-depth analysis detailing your home's value as well as a comparison with similar homes in the area
Home Values in the Area
Average Home Value in this Area
Purchase History
| Date | Buyer | Sale Price | Title Company |
|---|---|---|---|
| Rusk Daniel D | $399,000 | Stewart Title Of Northern Nv | |
| Williams Oliver B | $271,000 | Western Title Inc |
Source: Public Records
Mortgage History
| Date | Status | Borrower | Loan Amount |
|---|---|---|---|
| Open | Rusk Daniel D | $99,750 | |
| Previous Owner | Williams Oliver B | $171,000 |
Source: Public Records
Tax History Compared to Growth
Tax History
| Year | Tax Paid | Tax Assessment Tax Assessment Total Assessment is a certain percentage of the fair market value that is determined by local assessors to be the total taxable value of land and additions on the property. | Land | Improvement |
|---|---|---|---|---|
| 2025 | $3,406 | $141,224 | $44,555 | $96,669 |
| 2024 | $3,406 | $139,563 | $42,000 | $97,563 |
| 2023 | $3,307 | $134,741 | $41,545 | $93,196 |
| 2022 | $3,211 | $119,056 | $42,035 | $77,021 |
| 2021 | $3,118 | $101,890 | $25,200 | $76,690 |
| 2020 | $3,026 | $104,788 | $27,300 | $77,488 |
| 2019 | $2,938 | $100,232 | $26,250 | $73,982 |
| 2018 | $2,856 | $95,371 | $22,750 | $72,621 |
| 2017 | $2,773 | $91,153 | $18,375 | $72,778 |
| 2016 | $2,702 | $91,049 | $17,150 | $73,899 |
| 2015 | $2,697 | $90,139 | $15,750 | $74,389 |
| 2014 | $2,619 | $84,257 | $12,215 | $72,042 |
| 2013 | -- | $69,235 | $9,030 | $60,205 |
Source: Public Records
Map
Nearby Homes
- 970 Demos Ct
- 2135 Barberry Way
- 34 Cabernet Pkwy
- 2140 Barberry Way
- 20 Semillon Ct
- 1080 S University Park Loop
- 730 Icarus Ct
- 15 Chianti Way
- 1120 University Park Ct
- 2730 Dahlia Way
- 865 N University Park Loop
- 1175 Arrastra Rd Unit Lot 13
- 27 Chianti Way
- 1176 Arrastra Rd Unit Lot 16
- 1172 Arrastra Rd
- 29 Chianti Way
- 3495 Comstock Dr
- 2007 Valley Rd
- 2528 Comstock Dr
- 3648 Hollywood Park Dr
- 950 Stadium View Ct
- 955 Stadium View Ct
- 1184 University Ridge Dr
- 860 Mackey Ct Unit 8
- 970 Stadium View Ct
- 975 Stadium View Ct
- 880 Mackey Ct
- 1174 University Ridge Dr
- 1164 University Ridge Dr
- 1134 University Ridge Dr
- 865 Mackey Ct
- 990 Stadium View Ct Unit 8
- 1124 University Ridge Dr
- 1114 University Ridge Dr
- 1154 University Ridge Dr
- 1104 University Ridge Dr
- 1191 University Ridge Dr
- 811 Aristotle Dr
- 1181 University Ridge Dr
- 1175 University Ridge Dr