Estimated Value: $732,000 - $997,279
3
Beds
3
Baths
2,241
Sq Ft
$391/Sq Ft
Est. Value
About This Home
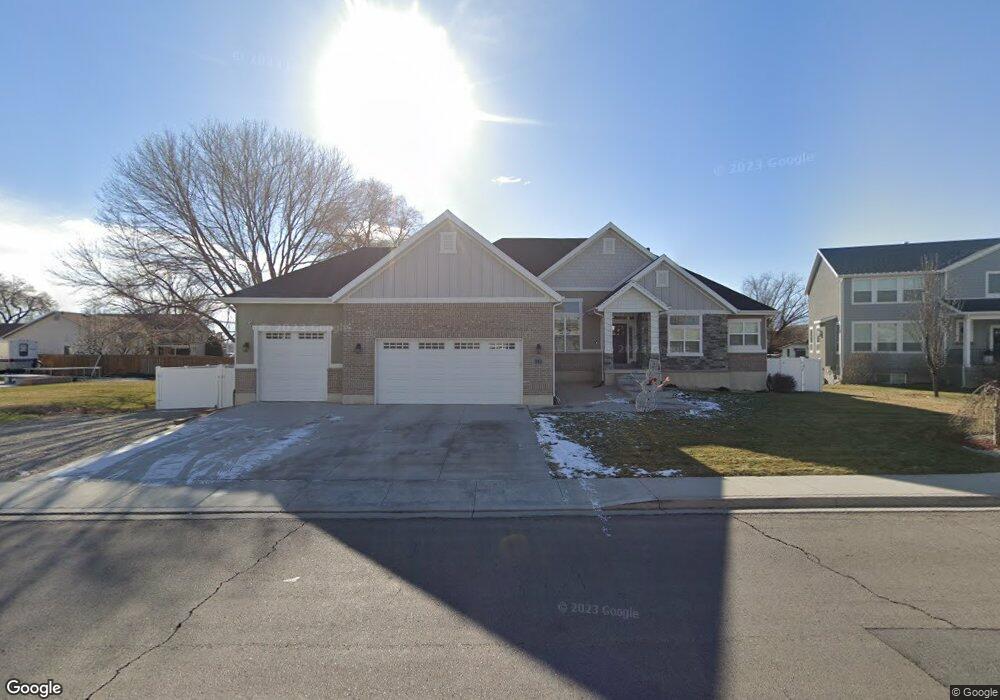
This home is located at 945 W 525 N, Lehi, UT 84043 and is currently estimated at $875,320, approximately $390 per square foot. 945 W 525 N is a home with nearby schools including Lehi Elementary School, Lehi Junior High School, and Lehi High School.
Ownership History
Date
Name
Owned For
Owner Type
Purchase Details
Closed on
Dec 8, 2016
Sold by
Terra Michelle Homes Inc
Bought by
Fail Joseph B and Fail Amy M
Current Estimated Value
Home Financials for this Owner
Home Financials are based on the most recent Mortgage that was taken out on this home.
Original Mortgage
$365,000
Outstanding Balance
$294,275
Interest Rate
3.47%
Mortgage Type
New Conventional
Estimated Equity
$581,045
Purchase Details
Closed on
Jun 25, 2015
Sold by
Easton Robert Ray and Easton Catherine Madge
Bought by
Terramichelle Homes Inc
Create a Home Valuation Report for This Property
The Home Valuation Report is an in-depth analysis detailing your home's value as well as a comparison with similar homes in the area
Home Values in the Area
Average Home Value in this Area
Purchase History
| Date | Buyer | Sale Price | Title Company |
|---|---|---|---|
| Fail Joseph B | -- | Metro National Title | |
| Terramichelle Homes Inc | -- | Metro National Title |
Source: Public Records
Mortgage History
| Date | Status | Borrower | Loan Amount |
|---|---|---|---|
| Open | Fail Joseph B | $365,000 |
Source: Public Records
Tax History Compared to Growth
Tax History
| Year | Tax Paid | Tax Assessment Tax Assessment Total Assessment is a certain percentage of the fair market value that is determined by local assessors to be the total taxable value of land and additions on the property. | Land | Improvement |
|---|---|---|---|---|
| 2025 | $3,573 | $468,105 | $330,700 | $520,400 |
| 2024 | $3,573 | $418,110 | $0 | $0 |
| 2023 | $3,336 | $423,885 | $0 | $0 |
| 2022 | $3,338 | $411,235 | $0 | $0 |
| 2021 | $2,960 | $551,200 | $191,400 | $359,800 |
| 2020 | $2,790 | $513,500 | $177,200 | $336,300 |
| 2019 | $2,454 | $469,600 | $177,200 | $292,400 |
| 2018 | $2,245 | $406,200 | $151,900 | $254,300 |
| 2017 | $2,102 | $202,180 | $0 | $0 |
| 2016 | $1,608 | $143,500 | $0 | $0 |
| 2015 | $1,492 | $126,400 | $0 | $0 |
| 2014 | $1,155 | $97,300 | $0 | $0 |
Source: Public Records
Map
Nearby Homes