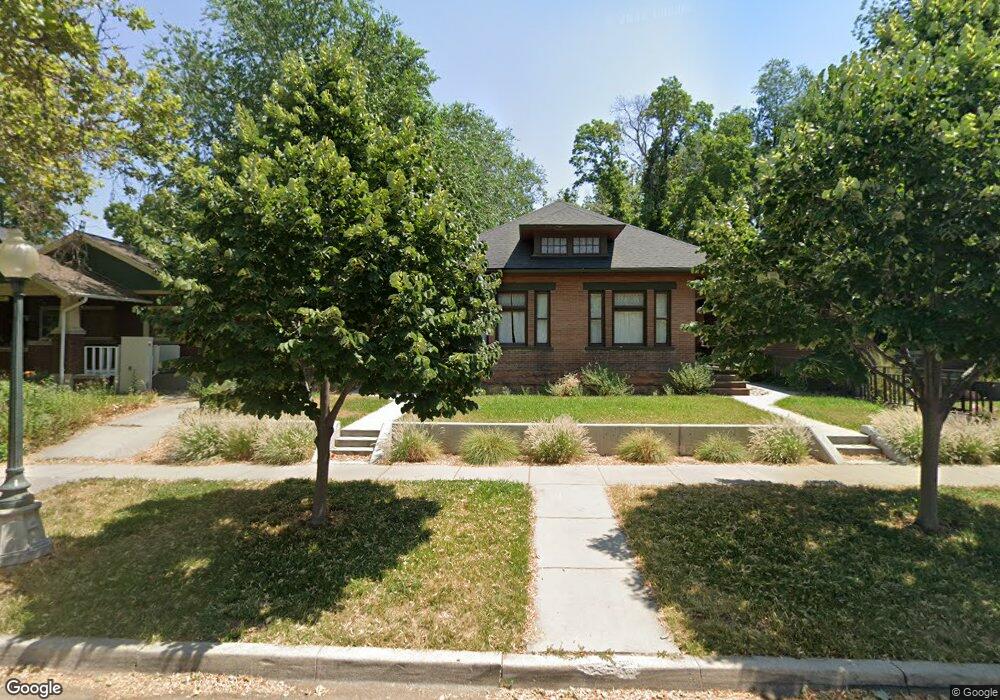
945 Windsor St Unit 949 Salt Lake City, UT 84105
East Central NeighborhoodEstimated Value: $661,000 - $800,000
2
Beds
2
Baths
1,605
Sq Ft
$438/Sq Ft
Est. Value
About This Home
This home is located at 945 Windsor St Unit 949, Salt Lake City, UT 84105 and is currently estimated at $703,021, approximately $438 per square foot. 945 Windsor St Unit 949 is a home located in Salt Lake County with nearby schools including Emerson School, Clayton Middle School, and East High School.
Ownership History
Date
Name
Owned For
Owner Type
Purchase Details
Closed on
Jun 30, 1997
Sold by
Plumb Robert A and Plumb Rebekah M
Bought by
Mullenax Steven Murrah
Current Estimated Value
Home Financials for this Owner
Home Financials are based on the most recent Mortgage that was taken out on this home.
Original Mortgage
$110,400
Outstanding Balance
$16,398
Interest Rate
7.91%
Estimated Equity
$686,623
Purchase Details
Closed on
Apr 24, 1997
Sold by
Kruger Constance M
Bought by
Plumb Robert A and Plumb Rebekah M
Create a Home Valuation Report for This Property
The Home Valuation Report is an in-depth analysis detailing your home's value as well as a comparison with similar homes in the area
Home Values in the Area
Average Home Value in this Area
Purchase History
| Date | Buyer | Sale Price | Title Company |
|---|---|---|---|
| Mullenax Steven Murrah | -- | Paramount Title Corp | |
| Plumb Robert A | -- | First American Title |
Source: Public Records
Mortgage History
| Date | Status | Borrower | Loan Amount |
|---|---|---|---|
| Open | Mullenax Steven Murrah | $110,400 |
Source: Public Records
Tax History Compared to Growth
Tax History
| Year | Tax Paid | Tax Assessment Tax Assessment Total Assessment is a certain percentage of the fair market value that is determined by local assessors to be the total taxable value of land and additions on the property. | Land | Improvement |
|---|---|---|---|---|
| 2025 | $3,239 | $626,600 | $252,700 | $373,900 |
| 2024 | $3,239 | $618,100 | $239,100 | $379,000 |
| 2023 | $3,243 | $596,500 | $229,900 | $366,600 |
| 2022 | $3,277 | $565,500 | $225,400 | $340,100 |
| 2021 | $3,136 | $489,900 | $171,500 | $318,400 |
| 2020 | $3,066 | $455,900 | $163,700 | $292,200 |
| 2019 | $3,199 | $447,600 | $155,800 | $291,800 |
| 2018 | $3,034 | $413,400 | $155,800 | $257,600 |
| 2017 | $1,844 | $235,400 | $155,800 | $79,600 |
| 2016 | $1,718 | $208,200 | $120,700 | $87,500 |
| 2015 | $1,759 | $202,100 | $128,000 | $74,100 |
| 2014 | $1,544 | $176,000 | $115,900 | $60,100 |
Source: Public Records
Map
Nearby Homes
- 945 S Windsor St
- 951 Windsor St
- 937 Windsor St
- 951 S Windsor St
- 855 Belmont Ave
- 855 E Belmont Ave
- 931 Windsor St
- 861 Belmont Ave
- 861 E Belmont Ave
- 851 Belmont Ave
- 865 Belmont Ave
- 927 Windsor St
- 927 S Windsor St
- 942 S 900 E
- 923 Windsor St
- 923 S Windsor St
- 946 S 900 E Unit 948
- 940 S 900 E
- 952 S 900 E
- 932 S 900 E