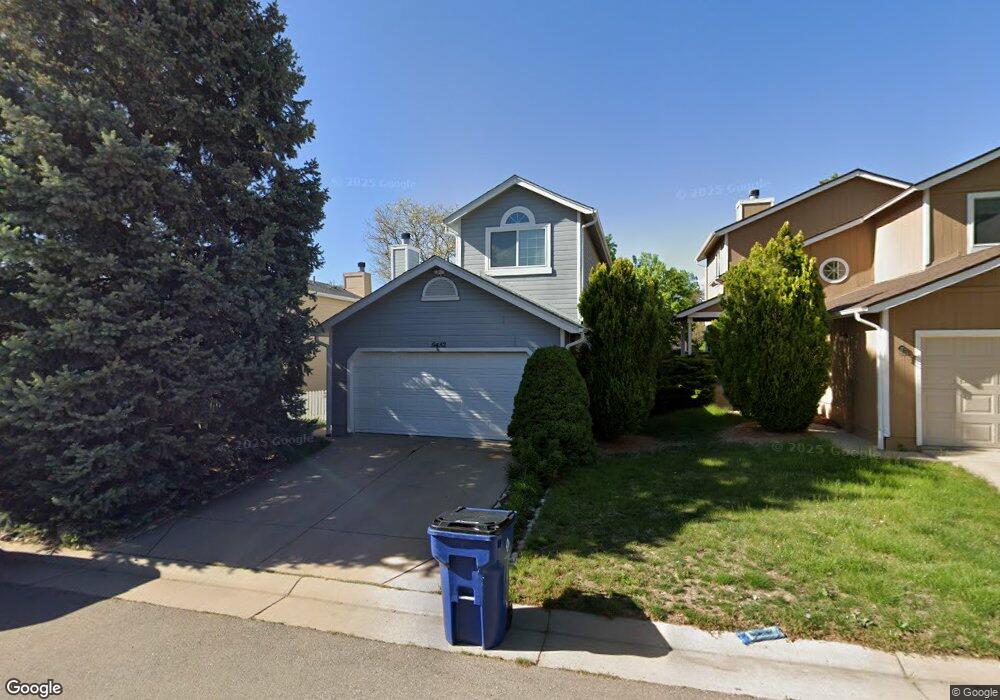
9452 Devon Ct Highlands Ranch, CO 80126
Northridge NeighborhoodEstimated Value: $508,957 - $537,000
3
Beds
1
Bath
1,315
Sq Ft
$398/Sq Ft
Est. Value
About This Home
This home is located at 9452 Devon Ct, Highlands Ranch, CO 80126 and is currently estimated at $522,989, approximately $397 per square foot. 9452 Devon Ct is a home located in Douglas County with nearby schools including Bear Canyon Elementary School, Mountain Ridge Middle School, and Mountain Vista High School.
Ownership History
Date
Name
Owned For
Owner Type
Purchase Details
Closed on
Apr 23, 1998
Sold by
Guilliom Gregory J
Bought by
Crawley Donald C and Crawley Hope L
Current Estimated Value
Home Financials for this Owner
Home Financials are based on the most recent Mortgage that was taken out on this home.
Original Mortgage
$141,729
Outstanding Balance
$24,750
Interest Rate
7.21%
Mortgage Type
VA
Estimated Equity
$498,239
Purchase Details
Closed on
Oct 27, 1995
Sold by
Anderson Dwight D
Bought by
Guilliom Gregory J
Home Financials for this Owner
Home Financials are based on the most recent Mortgage that was taken out on this home.
Original Mortgage
$115,900
Interest Rate
7.6%
Purchase Details
Closed on
Jun 8, 1992
Sold by
Gusmus June Marie
Bought by
Anderson Dwight D
Purchase Details
Closed on
Apr 29, 1986
Sold by
Mission Viejo Co
Bought by
Gusmus June Marie
Create a Home Valuation Report for This Property
The Home Valuation Report is an in-depth analysis detailing your home's value as well as a comparison with similar homes in the area
Home Values in the Area
Average Home Value in this Area
Purchase History
| Date | Buyer | Sale Price | Title Company |
|---|---|---|---|
| Crawley Donald C | $138,950 | First American Heritage Titl | |
| Guilliom Gregory J | $122,000 | North American Title | |
| Anderson Dwight D | $97,000 | -- | |
| Gusmus June Marie | $93,700 | -- |
Source: Public Records
Mortgage History
| Date | Status | Borrower | Loan Amount |
|---|---|---|---|
| Open | Crawley Donald C | $141,729 | |
| Previous Owner | Guilliom Gregory J | $115,900 |
Source: Public Records
Tax History
| Year | Tax Paid | Tax Assessment Tax Assessment Total Assessment is a certain percentage of the fair market value that is determined by local assessors to be the total taxable value of land and additions on the property. | Land | Improvement |
|---|---|---|---|---|
| 2025 | $3,018 | $33,080 | $6,660 | $26,420 |
| 2024 | $3,018 | $35,700 | $8,240 | $27,460 |
| 2023 | $3,012 | $35,700 | $8,240 | $27,460 |
| 2022 | $2,407 | $26,350 | $5,710 | $20,640 |
| 2021 | $2,504 | $26,350 | $5,710 | $20,640 |
| 2020 | $2,343 | $25,260 | $5,380 | $19,880 |
| 2019 | $2,351 | $25,260 | $5,380 | $19,880 |
| 2018 | $1,986 | $21,010 | $4,780 | $16,230 |
| 2017 | $1,808 | $21,010 | $4,780 | $16,230 |
| 2016 | $1,620 | $18,480 | $3,710 | $14,770 |
| 2015 | $1,655 | $18,480 | $3,710 | $14,770 |
| 2014 | $1,552 | $16,000 | $3,500 | $12,500 |
Source: Public Records
Map
Nearby Homes
- 839 Summer Dr Unit 1F
- 867 Summer Dr Unit 9C
- 805 Summer Dr Unit 805
- 529 Chiswick Cir
- 523 Chiswick Cir
- 9364 Cattail Ct
- 996 Cherry Blossom Ct
- 1146 Cherry Blossom Ct
- 9788 Isabel Ct
- 9240 Stargrass Cir
- 9717 Bexley Dr
- 9361 Crestmore Way
- 495 Ridgeglen Way
- 523 Timberline Place
- 1651 Beacon Hill Dr
- 1193 Phipps Ct
- 10015 Hughes Place
- 9090 Hunters Creek St
- 274 W Willowick Cir
- 144 Willowick Cir
Your Personal Tour Guide
Ask me questions while you tour the home.