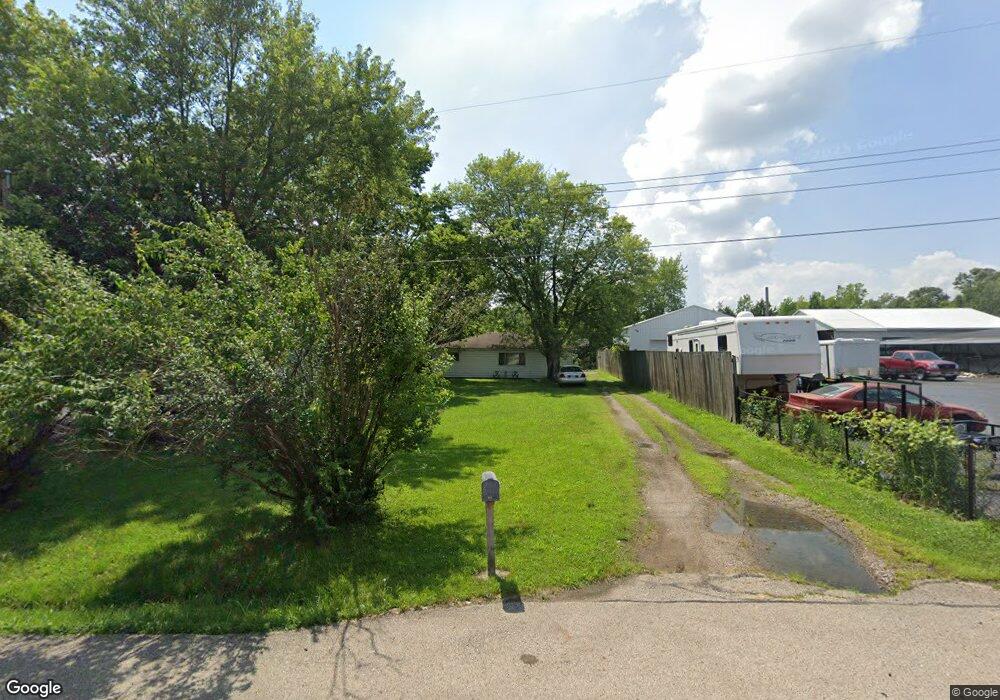
9453 Coleman Rd Miamisburg, OH 45342
Estimated Value: $150,983 - $185,000
3
Beds
1
Bath
1,120
Sq Ft
$149/Sq Ft
Est. Value
About This Home
This home is located at 9453 Coleman Rd, Miamisburg, OH 45342 and is currently estimated at $167,246, approximately $149 per square foot. 9453 Coleman Rd is a home located in Montgomery County with nearby schools including Alden R Brown Elementary School, Chamberlain Middle School, and Carlisle High School.
Ownership History
Date
Name
Owned For
Owner Type
Purchase Details
Closed on
Mar 14, 2011
Sold by
Moore Clasie
Bought by
Moore Benjamin L and Moore Christina
Current Estimated Value
Purchase Details
Closed on
Oct 12, 2002
Sold by
Tsm Partners Ltd
Bought by
Moore Vernon and Moore Clasie
Home Financials for this Owner
Home Financials are based on the most recent Mortgage that was taken out on this home.
Original Mortgage
$12,000
Interest Rate
6.34%
Purchase Details
Closed on
Mar 19, 2002
Sold by
First Bank National Association Tr
Bought by
Tsm Partners Ltd
Purchase Details
Closed on
Feb 6, 2001
Sold by
Witt Orvil E
Bought by
First Bank National Assn
Purchase Details
Closed on
Nov 6, 2000
Sold by
Witt Orvil E
Bought by
First Bank National Assn
Purchase Details
Closed on
Sep 7, 1996
Sold by
Witt Judy Ann
Bought by
Witt Orvil E
Create a Home Valuation Report for This Property
The Home Valuation Report is an in-depth analysis detailing your home's value as well as a comparison with similar homes in the area
Home Values in the Area
Average Home Value in this Area
Purchase History
| Date | Buyer | Sale Price | Title Company |
|---|---|---|---|
| Moore Benjamin L | -- | Attorney | |
| Moore Vernon | $15,000 | -- | |
| Tsm Partners Ltd | $10,000 | -- | |
| First Bank National Assn | $30,000 | -- | |
| First Bank National Assn | $30,000 | -- | |
| First Bank National Assn | $30,000 | -- | |
| Witt Orvil E | -- | -- |
Source: Public Records
Mortgage History
| Date | Status | Borrower | Loan Amount |
|---|---|---|---|
| Closed | Moore Vernon | $12,000 |
Source: Public Records
Tax History Compared to Growth
Tax History
| Year | Tax Paid | Tax Assessment Tax Assessment Total Assessment is a certain percentage of the fair market value that is determined by local assessors to be the total taxable value of land and additions on the property. | Land | Improvement |
|---|---|---|---|---|
| 2024 | $1,881 | $29,360 | $5,190 | $24,170 |
| 2023 | $1,881 | $29,360 | $5,190 | $24,170 |
| 2022 | $1,426 | $19,570 | $3,460 | $16,110 |
| 2021 | $1,360 | $19,570 | $3,460 | $16,110 |
| 2020 | $1,396 | $19,570 | $3,460 | $16,110 |
| 2019 | $1,180 | $15,650 | $3,460 | $12,190 |
| 2018 | $1,171 | $15,650 | $3,460 | $12,190 |
| 2017 | $1,205 | $15,650 | $3,460 | $12,190 |
| 2016 | $1,161 | $16,230 | $3,460 | $12,770 |
| 2015 | $1,142 | $16,230 | $3,460 | $12,770 |
| 2014 | $1,142 | $16,230 | $3,460 | $12,770 |
| 2012 | -- | $16,640 | $3,460 | $13,180 |
Source: Public Records
Map
Nearby Homes
- 9431 Coleman Rd
- 9489 Coleman Rd
- 6756 Faversham Rd
- 6757 Faversham Rd
- 9399 Coleman Rd
- 9476 Coleman Rd
- 92 Faversham Rd
- 9495 Coleman Rd
- 9412 Coleman Rd
- 6737 Faversham Rd
- 9523 Coleman Rd
- 9377 Coleman Rd
- 9396 Coleman Rd
- 6845 Farmington Rd
- 9533 Coleman Rd
- 6721 Faversham Rd
- 6701 Faversham Rd
- 6825 Farmington Rd
- 6787 Farmington Rd
- 6698 Faversham Rd