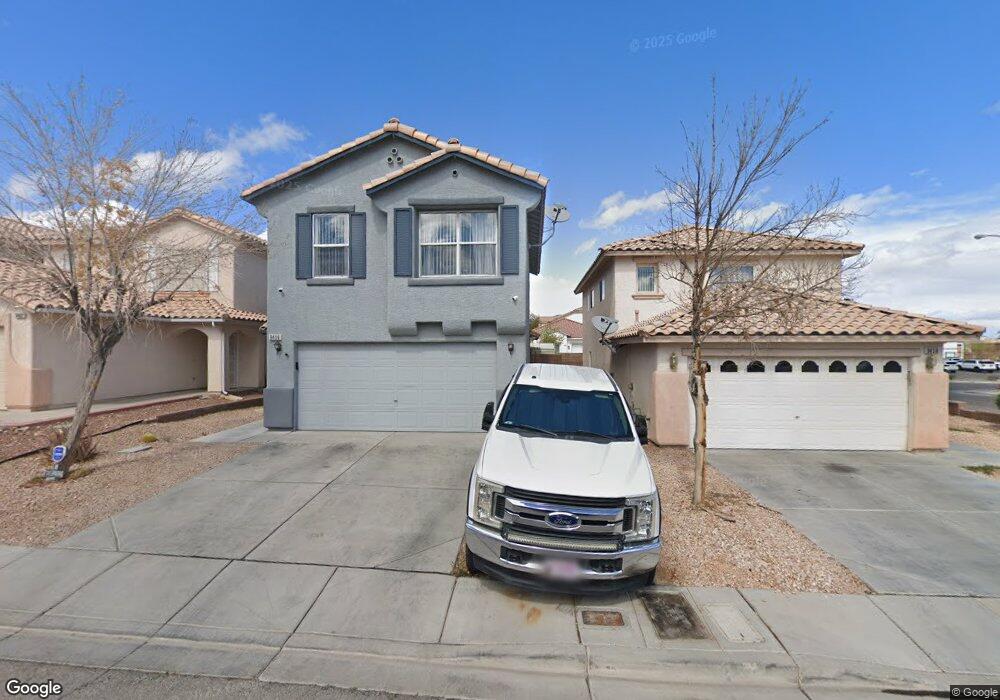
9456 Forbes Field Ct Las Vegas, NV 89148
Estimated Value: $421,000 - $455,000
4
Beds
3
Baths
1,602
Sq Ft
$272/Sq Ft
Est. Value
About This Home
This home is located at 9456 Forbes Field Ct, Las Vegas, NV 89148 and is currently estimated at $435,631, approximately $271 per square foot. 9456 Forbes Field Ct is a home located in Clark County with nearby schools including Kathy L. Batterman Elementary School, Victoria Fertitta Middle School, and Durango High School.
Ownership History
Date
Name
Owned For
Owner Type
Purchase Details
Closed on
May 18, 2017
Sold by
Rowland Karen E
Bought by
Karen Rowland Revocable Living Trust
Current Estimated Value
Purchase Details
Closed on
Jul 23, 2014
Sold by
Wong Bernard and Deist Rosemarie
Bought by
Rowland Michael R and Rowland Karen E
Home Financials for this Owner
Home Financials are based on the most recent Mortgage that was taken out on this home.
Original Mortgage
$164,000
Outstanding Balance
$124,919
Interest Rate
4.16%
Mortgage Type
New Conventional
Estimated Equity
$310,712
Purchase Details
Closed on
Nov 14, 2001
Sold by
Kb Home Nevada Inc
Bought by
Wong Bernard and Deist Rosemarie
Home Financials for this Owner
Home Financials are based on the most recent Mortgage that was taken out on this home.
Original Mortgage
$120,300
Interest Rate
6.62%
Create a Home Valuation Report for This Property
The Home Valuation Report is an in-depth analysis detailing your home's value as well as a comparison with similar homes in the area
Home Values in the Area
Average Home Value in this Area
Purchase History
| Date | Buyer | Sale Price | Title Company |
|---|---|---|---|
| Karen Rowland Revocable Living Trust | -- | None Available | |
| Rowland Michael R | $205,000 | Old Republic Title Co | |
| Wong Bernard | $150,382 | First American Title Co |
Source: Public Records
Mortgage History
| Date | Status | Borrower | Loan Amount |
|---|---|---|---|
| Open | Rowland Michael R | $164,000 | |
| Previous Owner | Wong Bernard | $120,300 |
Source: Public Records
Tax History Compared to Growth
Tax History
| Year | Tax Paid | Tax Assessment Tax Assessment Total Assessment is a certain percentage of the fair market value that is determined by local assessors to be the total taxable value of land and additions on the property. | Land | Improvement |
|---|---|---|---|---|
| 2025 | $1,479 | $104,958 | $43,750 | $61,208 |
| 2024 | $1,436 | $104,958 | $43,750 | $61,208 |
| 2023 | $1,172 | $94,433 | $36,400 | $58,033 |
| 2022 | $1,462 | $79,599 | $26,600 | $52,999 |
| 2021 | $1,354 | $75,643 | $25,200 | $50,443 |
| 2020 | $1,312 | $78,051 | $28,000 | $50,051 |
| 2019 | $1,296 | $69,836 | $20,650 | $49,186 |
| 2018 | $1,236 | $61,824 | $17,500 | $44,324 |
| 2017 | $1,797 | $61,260 | $16,450 | $44,810 |
| 2016 | $1,172 | $59,286 | $14,350 | $44,936 |
| 2015 | $1,169 | $55,158 | $10,850 | $44,308 |
| 2014 | $1,132 | $37,457 | $7,350 | $30,107 |
Source: Public Records
Map
Nearby Homes
- 9472 W Diablo Dr
- 9631 Tuscola Ct
- 5554 Chicory Falls Ct
- 9687 Ridgebluff Ave
- 9522 Arrowhead Falls Ct
- 5548 Anshan St
- 9217 Valley Betica Ave
- 9750 Maple Sugar Leaf Place
- 9205 Valley Betica Ave
- 5544 Jinsha River St
- 5533 Sterling Valley Ct
- 9173 Verdugo Ridge Ct
- 9731 Cathedral Stairs Ct
- 9693 Bighorn Island Ave
- 9862 Shadow Grove Ave
- 5554 Lushan St
- 5697 Tapestry Rose Ct
- 9580 W Reno Ave Unit 261
- 9580 W Reno Ave Unit 240
- 9580 W Reno Ave Unit 233
- 9462 Forbes Field Ct
- 9450 Forbes Field Ct
- 9450 Forbes Field Ct Unit none
- 9468 Forbes Field Ct
- 9474 Forbes Field Ct
- 9480 Forbes Field Ct
- 9457 Forbes Field Ct
- 9463 Forbes Field Ct
- 9451 Forbes Field Ct
- 5430 Jacobs Field St
- 9482 W Mesa Vista Ave
- 5426 Jacobs Field St
- 5434 Jacobs Field St
- 9469 Forbes Field Ct
- 9486 Forbes Field Ct
- 9476 W Mesa Vista Ave
- 9475 Forbes Field Ct
- 9488 W Mesa Vista Ave
- 5442 Jacobs Field St
- 9481 Forbes Field Ct