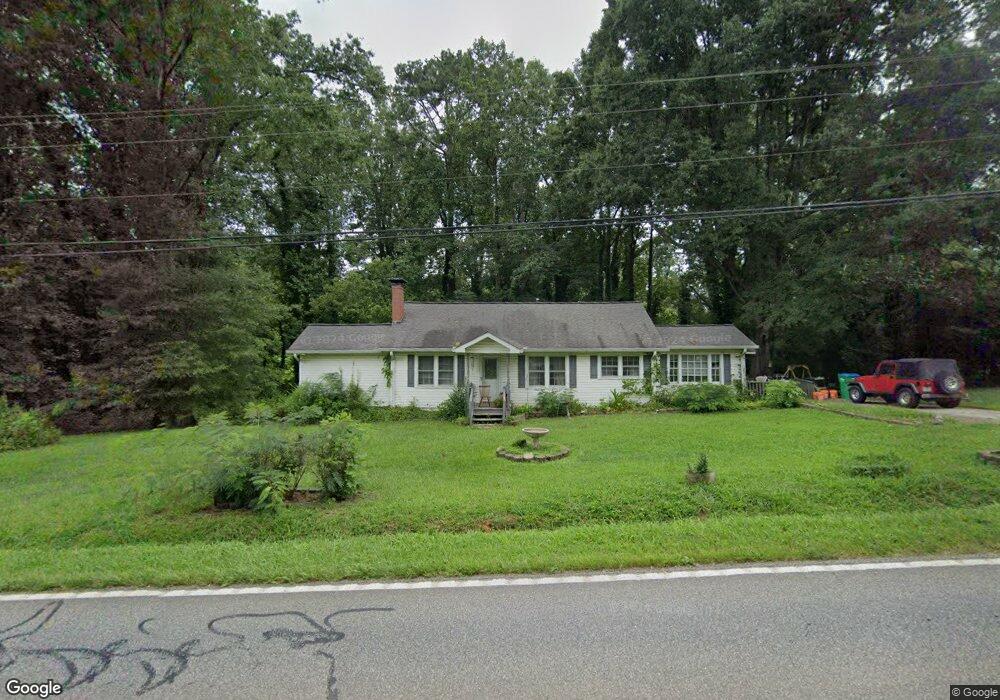
9458 Highway 53 W Talking Rock, GA 30175
Estimated Value: $171,542 - $335,000
--
Bed
1
Bath
1,428
Sq Ft
$177/Sq Ft
Est. Value
About This Home
This home is located at 9458 Highway 53 W, Talking Rock, GA 30175 and is currently estimated at $252,386, approximately $176 per square foot. 9458 Highway 53 W is a home located in Pickens County with nearby schools including Hill City Elementary School, Pickens County Middle School, and Pickens County High School.
Ownership History
Date
Name
Owned For
Owner Type
Purchase Details
Closed on
Nov 27, 2013
Sold by
Edwards Pamela
Bought by
Robinson Charles E
Current Estimated Value
Home Financials for this Owner
Home Financials are based on the most recent Mortgage that was taken out on this home.
Original Mortgage
$117,346
Outstanding Balance
$87,431
Interest Rate
4.13%
Mortgage Type
New Conventional
Estimated Equity
$164,955
Purchase Details
Closed on
Nov 16, 2011
Sold by
Edwards Jerry
Bought by
Edwards Pamela
Purchase Details
Closed on
May 7, 2003
Sold by
Burgess Clarence W
Bought by
Edwards Jerry
Purchase Details
Closed on
Nov 10, 2000
Sold by
Hamby Kathie L
Bought by
Burgess Clarence W
Purchase Details
Closed on
Jul 20, 1998
Bought by
Hamby Kathie L
Purchase Details
Closed on
Jun 16, 1994
Sold by
Edwards Jerry
Bought by
Burgess Clarence W
Purchase Details
Closed on
Jan 1, 1949
Sold by
Edwards Jerry
Bought by
Hamrick Leon C
Create a Home Valuation Report for This Property
The Home Valuation Report is an in-depth analysis detailing your home's value as well as a comparison with similar homes in the area
Home Values in the Area
Average Home Value in this Area
Purchase History
| Date | Buyer | Sale Price | Title Company |
|---|---|---|---|
| Robinson Charles E | $114,000 | -- | |
| Edwards Pamela | -- | -- | |
| Edwards Jerry | $35,000 | -- | |
| Burgess Clarence W | $51,000 | -- | |
| Hamby Kathie L | $58,000 | -- | |
| Burgess Clarence W | $31,000 | -- | |
| Hamrick Leon C | -- | -- |
Source: Public Records
Mortgage History
| Date | Status | Borrower | Loan Amount |
|---|---|---|---|
| Open | Robinson Charles E | $117,346 |
Source: Public Records
Tax History Compared to Growth
Tax History
| Year | Tax Paid | Tax Assessment Tax Assessment Total Assessment is a certain percentage of the fair market value that is determined by local assessors to be the total taxable value of land and additions on the property. | Land | Improvement |
|---|---|---|---|---|
| 2024 | $683 | $39,530 | $5,226 | $34,304 |
| 2023 | $702 | $39,530 | $5,226 | $34,304 |
| 2022 | $702 | $39,530 | $5,226 | $34,304 |
| 2021 | $752 | $39,530 | $5,226 | $34,304 |
| 2020 | $775 | $39,530 | $5,226 | $34,304 |
| 2019 | $793 | $39,530 | $5,226 | $34,304 |
| 2018 | $800 | $39,530 | $5,226 | $34,304 |
| 2017 | $813 | $39,530 | $5,226 | $34,304 |
| 2016 | $822 | $39,329 | $5,025 | $34,304 |
| 2015 | $802 | $39,329 | $5,025 | $34,304 |
| 2014 | $804 | $39,329 | $5,025 | $34,304 |
| 2013 | -- | $20,892 | $4,535 | $16,357 |
Source: Public Records
Map
Nearby Homes
- 3 Carver Mill Rd
- 19 Thomason Farm Dr
- 0 Stonecrest Rd
- 0 Pin Hook Rd Unit 7616347
- 110 Jerusalem Farms Dr
- 1514 Bryant Rd
- 200 Willow Ln
- 140 Jerusalem Church Rd
- 0 Black Knob Church Rd - Tract 3
- 1653 Thompson Ln
- 0 Black Knob Church Rd Unit TRACT 3
- 0 Black Knob Church Rd Unit TRACT 2
- 88 Woody Way
- 000 Black Knob Church Rd
- 0 Black Knob Church Rd - Tract 2
- 629 Georgia 136 Connector
- 188 Hwy 136 Connector
- 1504 Pinhook Rd
- 1504 Pinhook Rd
- 186 Hwy 136 Connector
- 9400 Highway 53 W
- 9401 Highway 53 W
- 9375 Highway 53 W
- 9554 Highway 53 W
- 9465 Highway 53 W
- 129 Carver Mill Rd
- * Highway 53 W
- 01 Carver Mill Rd
- 1 Carver Mill Rd
- 03 Carver Mill Rd
- 5 Carver Mill Rd
- 201 Carver Mill Rd
- 21 Hamrick Rd
- T4 Carver Mill Rd
- T2 Carver Mill Rd
- 23 Hamrick Rd
- 25 Hamrick Rd
- 27 Hamrick Rd
- 0 Carver Mill Rd Rd Unit 4
- 02 Carver Mill Rd