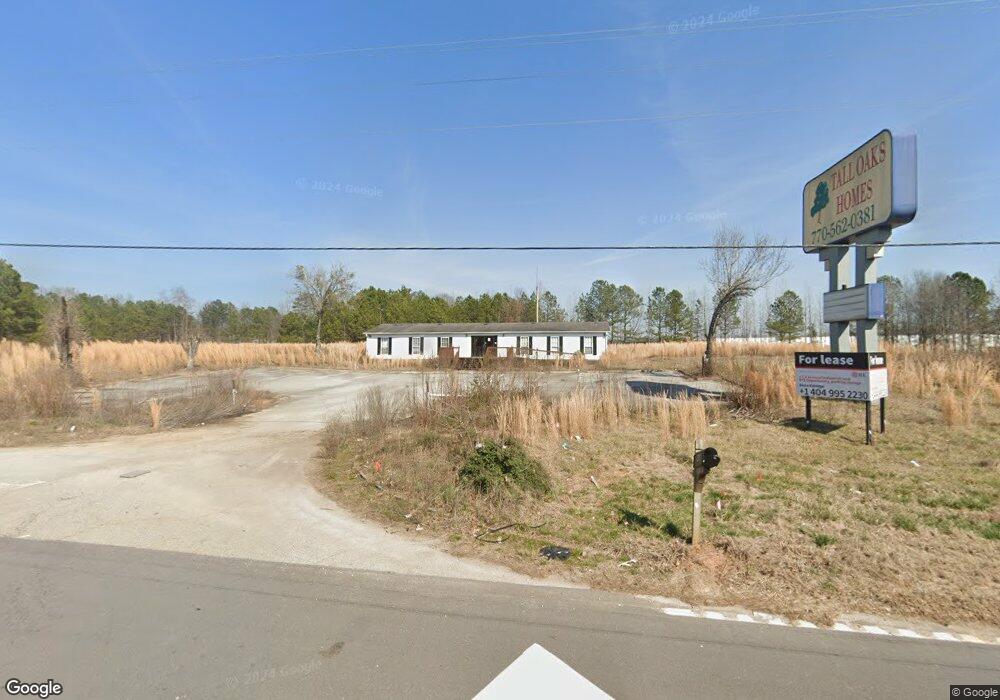
946 Carrollton Hwy Temple, GA 30179
Abilene NeighborhoodEstimated Value: $2,144,416
--
Bed
2
Baths
2,220
Sq Ft
$966/Sq Ft
Est. Value
About This Home
This home is located at 946 Carrollton Hwy, Temple, GA 30179 and is currently estimated at $2,144,416, approximately $965 per square foot. 946 Carrollton Hwy is a home located in Carroll County with nearby schools including Sharp Creek Elementary School, Temple Middle School, and Temple High School.
Ownership History
Date
Name
Owned For
Owner Type
Purchase Details
Closed on
Aug 11, 2022
Sold by
Jordan Commercial Properties Llc
Bought by
Iin Temple Llc
Current Estimated Value
Purchase Details
Closed on
Nov 13, 2012
Sold by
Charterbank
Bought by
Jordan Commercial Properties L
Purchase Details
Closed on
Sep 9, 2010
Sold by
Mcintosh Commercial Bk By Fdic
Bought by
Charterbank
Purchase Details
Closed on
Mar 29, 2010
Sold by
Mcintosh Commercial Bank
Bought by
Charterbank
Purchase Details
Closed on
Mar 3, 2009
Sold by
Mcintosh Commercial Bank
Bought by
Mcintosh Commercial Bank
Purchase Details
Closed on
Aug 16, 2002
Sold by
Beatty E Christiine
Bought by
Howard & Reece Inv Inc
Purchase Details
Closed on
Jun 23, 2000
Sold by
Howard & Reece Inv I
Bought by
Howard & Reece Inv I
Purchase Details
Closed on
Sep 8, 1998
Sold by
Land Acquisition Mgm
Bought by
Howard & Reece Inv I
Create a Home Valuation Report for This Property
The Home Valuation Report is an in-depth analysis detailing your home's value as well as a comparison with similar homes in the area
Home Values in the Area
Average Home Value in this Area
Purchase History
| Date | Buyer | Sale Price | Title Company |
|---|---|---|---|
| Iin Temple Llc | $1,115,000 | -- | |
| Jordan Commercial Properties L | $167,000 | -- | |
| Charterbank | -- | -- | |
| Charterbank | -- | -- | |
| Mcintosh Commercial Bank | $2,884,260 | -- | |
| Howard & Reece Inv Inc | $125,000 | -- | |
| Howard & Reece Inv Inc | -- | -- | |
| Howard & Reece Inv I | -- | -- | |
| Howard & Reece Inv I | $425,000 | -- |
Source: Public Records
Tax History Compared to Growth
Tax History
| Year | Tax Paid | Tax Assessment Tax Assessment Total Assessment is a certain percentage of the fair market value that is determined by local assessors to be the total taxable value of land and additions on the property. | Land | Improvement |
|---|---|---|---|---|
| 2024 | $19,002 | $848,468 | $788,868 | $59,600 |
| 2023 | $19,002 | $297,850 | $277,368 | $20,482 |
| 2022 | $7,479 | $298,196 | $277,368 | $20,828 |
| 2021 | $4,668 | $182,074 | $160,020 | $22,054 |
| 2020 | $4,718 | $183,799 | $160,020 | $23,779 |
| 2019 | $4,756 | $183,799 | $160,020 | $23,779 |
| 2018 | $4,762 | $181,341 | $160,020 | $21,321 |
| 2017 | $4,777 | $181,341 | $160,020 | $21,321 |
| 2016 | $2,228 | $84,543 | $77,560 | $6,983 |
| 2015 | $2,338 | $83,593 | $77,560 | $6,033 |
| 2014 | $2,347 | $83,593 | $77,560 | $6,033 |
Source: Public Records
Map
Nearby Homes
- 105 Fawn Ln
- 105 Rocking D Rd
- 216 Hunt Club Cir
- 374 Daffodil Dr
- 224 Villa Rica Springs
- 28 Hickory Trail
- 249 Carrollton St
- 355 Double d Rd
- 384 Double d Rd
- 501 Azalea Way
- 501 Azalea Way Unit 49
- 503 Azalea Way Unit 50
- 513 Azalea Way Unit 55
- 515 Azalea Way Unit 56
- 503 Azalea Way
- 511 Azalea Way Unit 54
- 28 Ringer St
- 108 Villa Rosa Ridge
- 68 Villa Rosa Dr
- W W Luke Rd
- 1058 Carrollton St
- 1031 Carrollton St
- 1031 Carrollton Hwy
- 1058 Carrollton Hwy
- 1058 Carrolton Hwy
- 1062 Carrollton Hwy
- 1062 Carrollton Hwy
- 0 Carrollton St
- 0 Carrollton St Unit 3245139
- 0 Carrollton St Unit 7592076
- 0 Carrollton St Unit 7018514
- 0 Carrollton St Unit 7617104
- 0 Carrollton St Unit 7538005
- 0 Carrollton St Unit 3153738
- 0 Carrollton St Unit 7407156
- 0 Carrollton St Unit 3244312
- 0 Carrollton St Unit 7156572
- 0 Carrollton St Unit 9030945
- 0 Carrollton St Unit 9014209