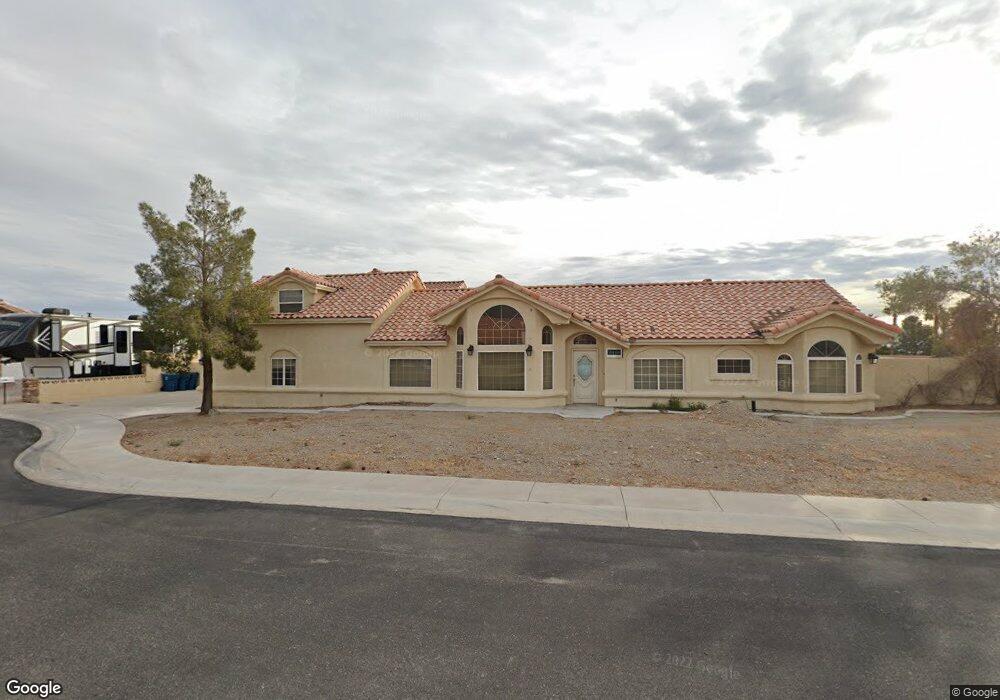
9460 W Washburn Rd Unit n/a Las Vegas, NV 89149
La Madre Foothills NeighborhoodEstimated Value: $1,023,000 - $1,277,180
4
Beds
5
Baths
5,003
Sq Ft
$231/Sq Ft
Est. Value
About This Home
This home is located at 9460 W Washburn Rd Unit n/a, Las Vegas, NV 89149 and is currently estimated at $1,156,295, approximately $231 per square foot. 9460 W Washburn Rd Unit n/a is a home located in Clark County with nearby schools including Dean Lamar Allen Elementary School, Justice Myron E Leavitt Middle School, and Centennial High School.
Ownership History
Date
Name
Owned For
Owner Type
Purchase Details
Closed on
Jun 30, 2016
Sold by
King Carol D and King 3Rex E
Bought by
Salah Mike
Current Estimated Value
Purchase Details
Closed on
Oct 22, 2008
Sold by
King Rex E and King Carol D
Bought by
King Carol D and King Rex E
Home Financials for this Owner
Home Financials are based on the most recent Mortgage that was taken out on this home.
Original Mortgage
$417,000
Interest Rate
5.9%
Mortgage Type
New Conventional
Purchase Details
Closed on
Jul 18, 2001
Sold by
King Carol
Bought by
King Rex E and King Carol D
Home Financials for this Owner
Home Financials are based on the most recent Mortgage that was taken out on this home.
Original Mortgage
$237,750
Interest Rate
7.21%
Create a Home Valuation Report for This Property
The Home Valuation Report is an in-depth analysis detailing your home's value as well as a comparison with similar homes in the area
Home Values in the Area
Average Home Value in this Area
Purchase History
| Date | Buyer | Sale Price | Title Company |
|---|---|---|---|
| Salah Mike | $365,500 | Ticor Title Las Vegas | |
| King Carol D | -- | Nevada Title Las Vegas | |
| King Rex E | -- | Nevada Title Company |
Source: Public Records
Mortgage History
| Date | Status | Borrower | Loan Amount |
|---|---|---|---|
| Previous Owner | King Carol D | $417,000 | |
| Previous Owner | King Rex E | $237,750 |
Source: Public Records
Tax History Compared to Growth
Tax History
| Year | Tax Paid | Tax Assessment Tax Assessment Total Assessment is a certain percentage of the fair market value that is determined by local assessors to be the total taxable value of land and additions on the property. | Land | Improvement |
|---|---|---|---|---|
| 2025 | $4,304 | $293,296 | $105,000 | $188,296 |
| 2024 | $4,179 | $293,296 | $105,000 | $188,296 |
| 2023 | $4,381 | $264,408 | $85,750 | $178,658 |
| 2022 | $4,254 | $232,744 | $70,000 | $162,744 |
| 2021 | $4,119 | $216,811 | $61,250 | $155,561 |
| 2020 | $3,959 | $215,597 | $61,250 | $154,347 |
| 2019 | $3,775 | $213,578 | $61,250 | $152,328 |
| 2018 | $3,602 | $195,062 | $49,000 | $146,062 |
| 2017 | $5,182 | $190,065 | $42,000 | $148,065 |
| 2016 | $3,410 | $171,221 | $31,500 | $139,721 |
| 2015 | $3,405 | $146,793 | $17,500 | $129,293 |
| 2014 | $3,305 | $118,299 | $17,500 | $100,799 |
Source: Public Records
Map
Nearby Homes
- 5120 Lone View Place
- 9511 Star Vista Ct
- 9340 W Washburn Rd
- 5309 N Chieftain St
- 5165 Dusk Skyscape St
- 5181 Dusk Skyscape St
- 5197 Dusk Skyscape St
- Kathryn NextGen w/RV Plan at The Estates - Ann
- Leighton NextGen w/RV Plan at The Estates - El Capitan
- Ganon NextGen w/RV Plan at The Estates - Ann
- Ganon NextGen w/RV Plan at The Estates - El Capitan
- Leighton NextGen w/RV Plan at The Estates - Ann
- Kathryn NextGen w/RV Plan at The Estates - El Capitan
- 5315 N Fort Apache Rd
- 9471 New Discovery Ave
- 9428 New Discovery Ave
- 9749 Glistening Brook Ct
- Ganon NextGen w/RV Plan at The Estates - Grand Canyon
- Kathryn NextGen w/RV Plan at The Estates - Grand Canyon
- Charles w/RV Plan at The Estates - Grand Canyon
- 9460 W Washburn Rd
- 9470 W Washburn Rd
- 9490 W Washburn Rd
- 9480 W Washburn Rd
- 9451 W Washburn Rd
- 9471 W Washburn Rd
- 9425 W Washburn Rd
- 9475 W Fisher Ave
- 9491 W Washburn Rd
- 5191 N Tee Pee Ln
- 9485 W Fisher Ave
- 9511 W Washburn Rd
- 5181 N Tee Pee Ln
- 9470 Star Vista Ct
- 9465 W Fisher Ave
- 5140 Lone View Place
- 9495 W Fisher Ave
- 9531 W Washburn Rd
- 5151 N Tee Pee Ln
- 9510 Star Vista Ct