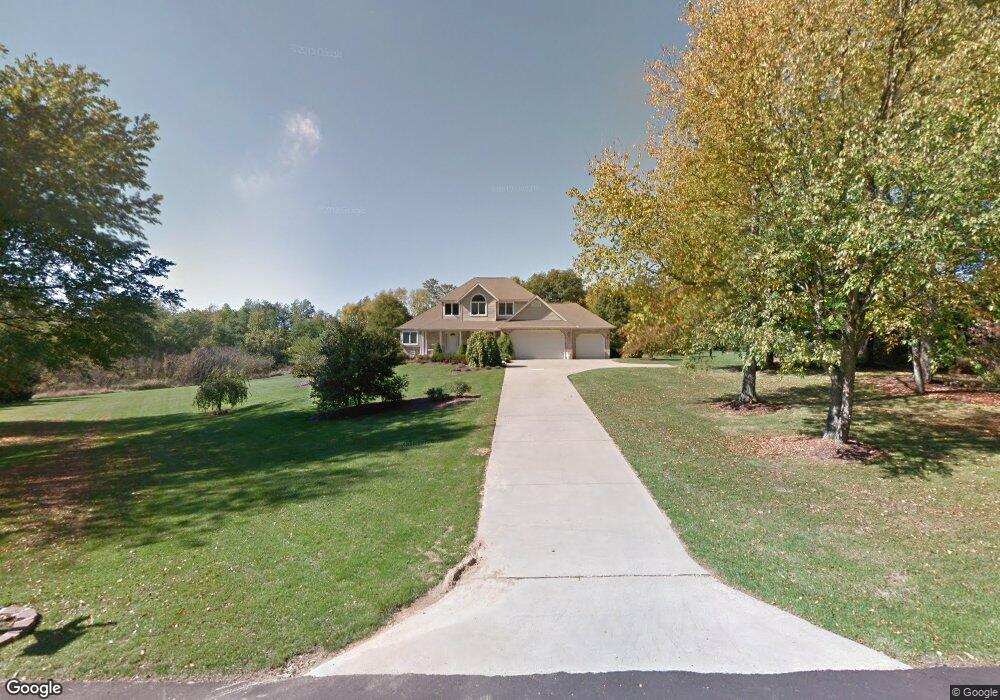
9464 Park Ridge Trail Unit 13 Berrien Center, MI 49102
Estimated Value: $570,911 - $641,000
5
Beds
4
Baths
3,150
Sq Ft
$189/Sq Ft
Est. Value
About This Home
This home is located at 9464 Park Ridge Trail Unit 13, Berrien Center, MI 49102 and is currently estimated at $596,728, approximately $189 per square foot. 9464 Park Ridge Trail Unit 13 is a home located in Berrien County with nearby schools including Mars Elementary School, Sylvester Elementary School, and Berrien Springs Middle School.
Ownership History
Date
Name
Owned For
Owner Type
Purchase Details
Closed on
May 18, 2005
Sold by
Mckinley Gary and Mckinley Evelyn B
Bought by
Gabriel Elvin S and Gabriel Cressida B
Current Estimated Value
Home Financials for this Owner
Home Financials are based on the most recent Mortgage that was taken out on this home.
Original Mortgage
$340,000
Outstanding Balance
$178,075
Interest Rate
5.91%
Mortgage Type
Fannie Mae Freddie Mac
Estimated Equity
$418,653
Purchase Details
Closed on
Mar 11, 2004
Sold by
Cendant Mobility Financial Corp
Bought by
Mckinley Gary and Mckinley Evelyn B
Home Financials for this Owner
Home Financials are based on the most recent Mortgage that was taken out on this home.
Original Mortgage
$239,200
Interest Rate
5.74%
Mortgage Type
Unknown
Purchase Details
Closed on
Nov 15, 1999
Purchase Details
Closed on
Jun 25, 1998
Create a Home Valuation Report for This Property
The Home Valuation Report is an in-depth analysis detailing your home's value as well as a comparison with similar homes in the area
Home Values in the Area
Average Home Value in this Area
Purchase History
| Date | Buyer | Sale Price | Title Company |
|---|---|---|---|
| Gabriel Elvin S | $340,000 | -- | |
| Mckinley Gary | $299,000 | Meridian Title Corp | |
| Cendant Mobility Financial Corp | $299,000 | Meridian Title Corp | |
| -- | $246,200 | -- | |
| -- | $35,000 | -- |
Source: Public Records
Mortgage History
| Date | Status | Borrower | Loan Amount |
|---|---|---|---|
| Open | Gabriel Elvin S | $340,000 | |
| Previous Owner | Cendant Mobility Financial Corp | $239,200 |
Source: Public Records
Tax History Compared to Growth
Tax History
| Year | Tax Paid | Tax Assessment Tax Assessment Total Assessment is a certain percentage of the fair market value that is determined by local assessors to be the total taxable value of land and additions on the property. | Land | Improvement |
|---|---|---|---|---|
| 2025 | $4,350 | $278,900 | $0 | $0 |
| 2024 | $3,593 | $261,200 | $0 | $0 |
| 2023 | $3,460 | $233,200 | $0 | $0 |
| 2022 | $3,403 | $212,200 | $0 | $0 |
| 2021 | $3,821 | $196,900 | $18,600 | $178,300 |
| 2020 | $3,769 | $190,500 | $0 | $0 |
| 2019 | $3,700 | $167,800 | $29,100 | $138,700 |
| 2018 | $3,228 | $167,800 | $0 | $0 |
| 2017 | $3,345 | $171,000 | $0 | $0 |
| 2016 | $3,241 | $161,300 | $0 | $0 |
| 2015 | $3,240 | $157,000 | $0 | $0 |
| 2014 | $2,953 | $166,200 | $0 | $0 |
Source: Public Records
Map
Nearby Homes
- 5835 Windy Acres Ln
- 5728 Orchard Dr
- 402 S Main St
- 305 S Main St
- 201 S Harrison St
- 520 N Bluff St
- 117 S Harrison St
- 312 N Cass St
- 315 E Washington St
- 535 N Bluff St
- 601 Ann Dr
- 5027 E Bluffview Dr
- 312 W Madison St
- 604 N Mechanic St
- 8974 Michigan 140
- 628 Saint Joseph Ave
- 8687 Lilac Ln
- 6211 Whitetail Ct
- 0 E Shawnee Rd Unit 25004845
- 8892 Maplewood Dr
- 9440 Park Ridge Trail
- 9488 Park Ridge Trail
- 9465 Park Ridge Trail Unit 24
- 9465 Park Ridge Trail Unit 3
- 9443 Park Ridge Trail
- 9503 Park Ridge Trail Unit 7
- 9427 Park Ridge Trail Unit 22
- 6077 Pokagon Rd
- 9524 Park Ridge Trail Unit 5
- 9392 Park Ridge Trail
- 9411 Park Ridge Trail
- 9607 Park Ridge Trail
- 9592 Fox Run
- 9458 Fox Run Unit 26
- 0 Park Ridge Trail
- 0 Park Ridge Trail
- 9446 Fox Run Unit 27
- 9368 Park Ridge Trail
- 9466 Fox Run Unit 25
- 9357 Park Ridge Trail