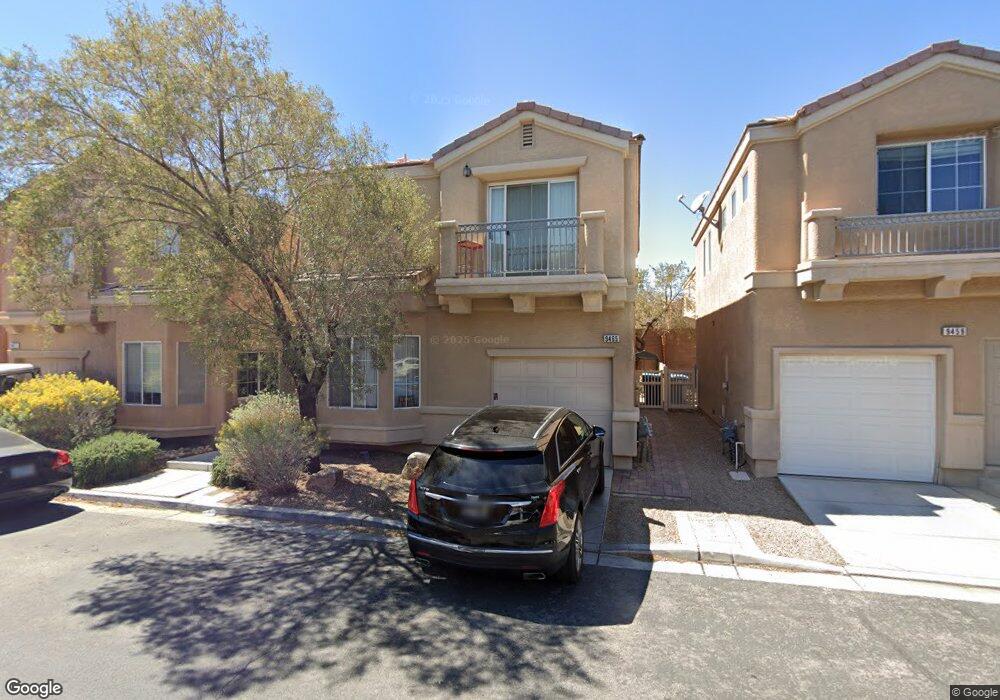
9465 Liquid Loco St Las Vegas, NV 89178
Mountains Edge NeighborhoodEstimated Value: $363,842 - $392,000
2
Beds
3
Baths
1,390
Sq Ft
$270/Sq Ft
Est. Value
About This Home
This home is located at 9465 Liquid Loco St, Las Vegas, NV 89178 and is currently estimated at $375,961, approximately $270 per square foot. 9465 Liquid Loco St is a home located in Clark County with nearby schools including William V. Wright Elementary School, Sierra Vista High School, and Doral Academy Cactus.
Ownership History
Date
Name
Owned For
Owner Type
Purchase Details
Closed on
Dec 7, 2005
Sold by
Ryland Homes Nevada Llc
Bought by
Harron Zain and Haroon Patricia
Current Estimated Value
Home Financials for this Owner
Home Financials are based on the most recent Mortgage that was taken out on this home.
Original Mortgage
$25,300
Interest Rate
6.32%
Mortgage Type
Stand Alone Second
Create a Home Valuation Report for This Property
The Home Valuation Report is an in-depth analysis detailing your home's value as well as a comparison with similar homes in the area
Home Values in the Area
Average Home Value in this Area
Purchase History
| Date | Buyer | Sale Price | Title Company |
|---|---|---|---|
| Harron Zain | $253,176 | Ryland Title |
Source: Public Records
Mortgage History
| Date | Status | Borrower | Loan Amount |
|---|---|---|---|
| Closed | Harron Zain | $25,300 | |
| Previous Owner | Harron Zain | $202,500 |
Source: Public Records
Tax History Compared to Growth
Tax History
| Year | Tax Paid | Tax Assessment Tax Assessment Total Assessment is a certain percentage of the fair market value that is determined by local assessors to be the total taxable value of land and additions on the property. | Land | Improvement |
|---|---|---|---|---|
| 2025 | $1,582 | $95,351 | $33,250 | $62,101 |
| 2024 | $1,465 | $95,351 | $33,250 | $62,101 |
| 2023 | $1,465 | $86,505 | $28,000 | $58,505 |
| 2022 | $1,357 | $77,785 | $24,500 | $53,285 |
| 2021 | $1,257 | $73,367 | $22,750 | $50,617 |
| 2020 | $1,164 | $71,468 | $21,350 | $50,118 |
| 2019 | $1,091 | $66,731 | $17,500 | $49,231 |
| 2018 | $1,041 | $61,083 | $14,000 | $47,083 |
| 2017 | $1,660 | $56,150 | $12,250 | $43,900 |
| 2016 | $1,227 | $50,056 | $9,800 | $40,256 |
| 2015 | $1,225 | $49,192 | $9,100 | $40,092 |
| 2014 | $942 | $31,883 | $3,850 | $28,033 |
Source: Public Records
Map
Nearby Homes
- 9443 Hot Breeze St
- 9534 Twister Trace St
- 9402 Crimson Sky St
- 9431 Mad Dog St
- 9571 Dawning Heat St
- 9161 Dutch Oven Ct
- 9145 Sunken Meadow Ave
- 9112 Harbor Wind Ave
- 9004 Harbor Wind Ave
- 9162 Weeping Hollow Ave
- 9175 Sunken Meadow Ave
- 8964 Tom Noon Ave
- 9341 Sea Captain St
- 9370 Corkfish St
- 8974 English Falls Way
- 9651 Bouncing Ball St
- 9659 Toy Soldier St
- 9258 Placer Bullion Ave
- 9091 Jumping Jacks Ave
- 9031 Jumping Jacks Ave
- 9471 Liquid Loco St
- 9459 Liquid Loco St
- 9459 Liquid Loco St
- 9459 Liquid Loco St
- 9459 Liquid Loco St
- 9477 Liquid Loco St
- 9464 Ore Cart St
- 9464 Ore Cart St
- 9464 Ore Cart St
- 9453 Liquid Loco St
- 9470 Ore Cart St
- 9458 Ore Cart St
- 9476 Ore Cart St
- 9452 Crimson Sky St
- 9466 Liquid Loco St
- 9472 Liquid Loco St
- 9447 Liquid Loco St
- 9460 Liquid Loco St
- 9460 Liquid Loco St Unit na
- 9478 Liquid Loco St