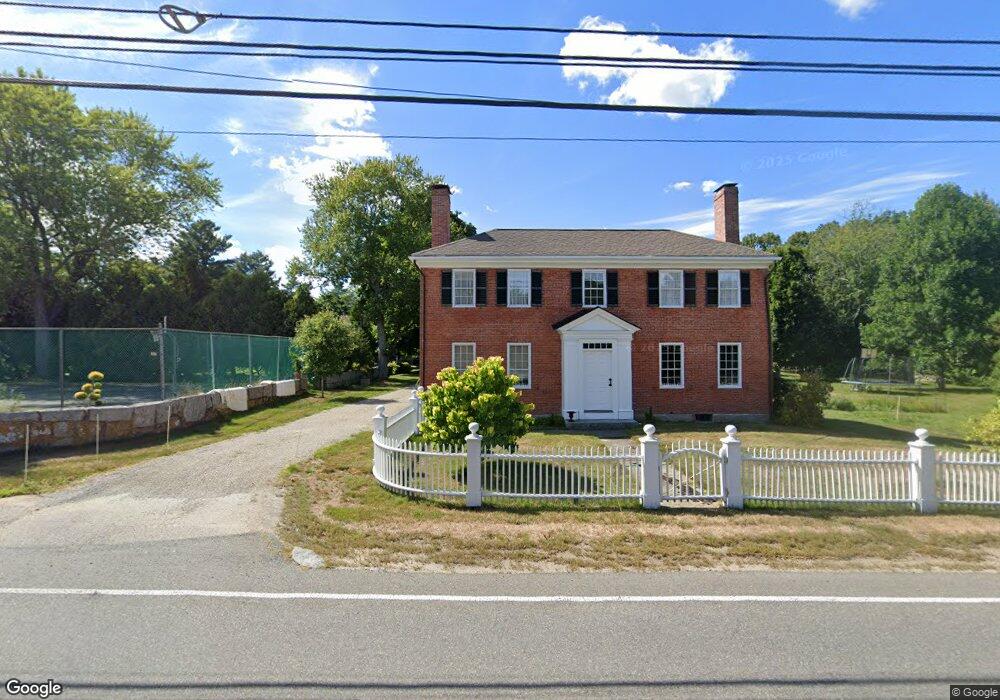
947 Broadway Hanover, MA 02339
Estimated Value: $904,000 - $1,198,000
5
Beds
4
Baths
4,158
Sq Ft
$258/Sq Ft
Est. Value
About This Home
This home is located at 947 Broadway, Hanover, MA 02339 and is currently estimated at $1,072,683, approximately $257 per square foot. 947 Broadway is a home located in Plymouth County with nearby schools including Hanover High School, Cadence Academy Preschool - Hanover, and Cardinal Cushing Centers.
Ownership History
Date
Name
Owned For
Owner Type
Purchase Details
Closed on
Dec 23, 2002
Sold by
Bennett George F
Bought by
Aamot Randall G and Aamot Sarah N
Current Estimated Value
Home Financials for this Owner
Home Financials are based on the most recent Mortgage that was taken out on this home.
Original Mortgage
$200,000
Interest Rate
6.16%
Mortgage Type
Purchase Money Mortgage
Create a Home Valuation Report for This Property
The Home Valuation Report is an in-depth analysis detailing your home's value as well as a comparison with similar homes in the area
Home Values in the Area
Average Home Value in this Area
Purchase History
| Date | Buyer | Sale Price | Title Company |
|---|---|---|---|
| Aamot Randall G | $425,709 | -- |
Source: Public Records
Mortgage History
| Date | Status | Borrower | Loan Amount |
|---|---|---|---|
| Open | Aamot Randall G | $170,418 | |
| Closed | Aamot Randall G | $200,000 |
Source: Public Records
Tax History Compared to Growth
Tax History
| Year | Tax Paid | Tax Assessment Tax Assessment Total Assessment is a certain percentage of the fair market value that is determined by local assessors to be the total taxable value of land and additions on the property. | Land | Improvement |
|---|---|---|---|---|
| 2025 | $11,362 | $920,000 | $410,000 | $510,000 |
| 2024 | $11,371 | $885,600 | $410,000 | $475,600 |
| 2023 | $11,585 | $858,800 | $379,700 | $479,100 |
| 2022 | $10,731 | $703,700 | $328,800 | $374,900 |
| 2021 | $12,258 | $664,200 | $305,700 | $358,500 |
| 2020 | $11,277 | $691,400 | $305,700 | $385,700 |
| 2019 | $4,755 | $628,800 | $305,700 | $323,100 |
| 2018 | $4,358 | $629,700 | $305,700 | $324,000 |
| 2017 | $6,425 | $622,200 | $307,200 | $315,000 |
| 2016 | $10,355 | $614,200 | $285,600 | $328,600 |
| 2015 | $9,092 | $563,000 | $305,200 | $257,800 |
Source: Public Records
Map
Nearby Homes