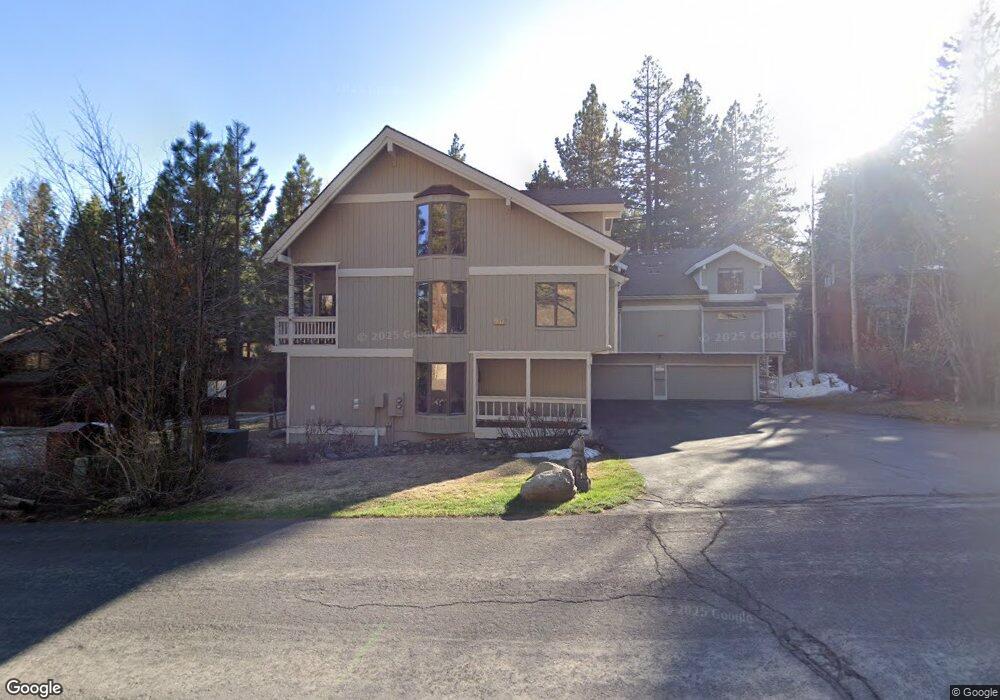
947 Divot Ct Unit 3 Incline Village, NV 89451
Estimated Value: $899,000 - $1,032,000
2
Beds
2
Baths
1,545
Sq Ft
$636/Sq Ft
Est. Value
About This Home
This home is located at 947 Divot Ct Unit 3, Incline Village, NV 89451 and is currently estimated at $983,152, approximately $636 per square foot. 947 Divot Ct Unit 3 is a home located in Washoe County with nearby schools including Incline Elementary School, Incline Middle School, and Incline High School.
Ownership History
Date
Name
Owned For
Owner Type
Purchase Details
Closed on
Jul 18, 2000
Sold by
Jackson Durward P
Bought by
Leary Christian J
Current Estimated Value
Home Financials for this Owner
Home Financials are based on the most recent Mortgage that was taken out on this home.
Original Mortgage
$220,000
Outstanding Balance
$78,556
Interest Rate
8.2%
Mortgage Type
Seller Take Back
Estimated Equity
$904,596
Purchase Details
Closed on
Apr 9, 1996
Sold by
Rudin A L
Bought by
Jackson Durward P
Home Financials for this Owner
Home Financials are based on the most recent Mortgage that was taken out on this home.
Original Mortgage
$99,650
Interest Rate
7.82%
Purchase Details
Closed on
Feb 16, 1996
Sold by
Schnee David Michael and Schnee Nancy Novis
Bought by
Rudin A L
Home Financials for this Owner
Home Financials are based on the most recent Mortgage that was taken out on this home.
Original Mortgage
$99,650
Interest Rate
7.82%
Create a Home Valuation Report for This Property
The Home Valuation Report is an in-depth analysis detailing your home's value as well as a comparison with similar homes in the area
Home Values in the Area
Average Home Value in this Area
Purchase History
| Date | Buyer | Sale Price | Title Company |
|---|---|---|---|
| Leary Christian J | $275,000 | Stewart Title Northern Nevad | |
| Jackson Durward P | $195,000 | Stewart Title | |
| Rudin A L | -- | -- | |
| Rudin A L | $13,000 | First American Title Co |
Source: Public Records
Mortgage History
| Date | Status | Borrower | Loan Amount |
|---|---|---|---|
| Open | Leary Christian J | $220,000 | |
| Previous Owner | Jackson Durward P | $99,650 |
Source: Public Records
Tax History Compared to Growth
Tax History
| Year | Tax Paid | Tax Assessment Tax Assessment Total Assessment is a certain percentage of the fair market value that is determined by local assessors to be the total taxable value of land and additions on the property. | Land | Improvement |
|---|---|---|---|---|
| 2025 | $2,372 | $114,059 | $78,645 | $35,414 |
| 2024 | $2,372 | $116,211 | $78,645 | $37,566 |
| 2023 | $2,322 | $112,412 | $78,645 | $33,767 |
| 2022 | $2,593 | $91,550 | $60,025 | $31,525 |
| 2021 | $2,540 | $67,592 | $35,770 | $31,822 |
| 2020 | $2,537 | $71,040 | $38,885 | $32,155 |
| 2019 | $2,487 | $65,732 | $33,880 | $31,852 |
| 2018 | $2,439 | $50,358 | $18,935 | $31,423 |
| 2017 | $2,392 | $49,699 | $18,235 | $31,464 |
| 2016 | $2,353 | $46,085 | $16,240 | $29,845 |
| 2015 | $2,349 | $45,675 | $16,695 | $28,980 |
| 2014 | $2,305 | $46,309 | $16,695 | $29,614 |
| 2013 | -- | $41,634 | $12,320 | $29,314 |
Source: Public Records
Map
Nearby Homes
- 949 Dana Ct Unit 14
- 711 Birdie Way
- 917 Jennifer St
- 936 Jennifer St
- 949 Jennifer St
- 790 Fairview Blvd
- 967 Jennifer St
- 770 Golfers Pass Rd
- 721 Cristina Dr
- 725 Fairview Blvd Unit 40
- 725 Fairview Blvd Unit 11
- 757 Champagne Rd
- 987 Wander Way
- 898 Peepsight Cir Unit 27B
- 696 Village Blvd Unit 24
- 696 Village Blvd Unit 20
- 1028 Apollo Way
- 647 Village Blvd Unit 3
- 714 Champagne Rd
- 949 Fairview Blvd
- 947 Divot Ct
- 947 Divot Ct Unit 2
- 947 Divot Ct Unit 1
- 947 Divot Ct Unit 4
- 945 Divot Ct
- 945 Divot Ct
- 945 Divot Ct
- 945 Divot Ct
- 945 Divot Ct Unit 2
- 945 Divot Ct Unit 3
- 943 Divot Ct Unit 2
- 943 Divot Ct
- 943 Divot Ct
- 943 Divot Ct Unit 1
- 951 Divot Ct
- 944 Divot Ct Unit 2
- 944 Divot Ct
- 944 Divot Ct Unit 3
- 941 Divot Ct Unit 2
- 941 Divot Ct