Estimated Value: $59,000 - $85,000
2
Beds
1
Bath
784
Sq Ft
$87/Sq Ft
Est. Value
About This Home
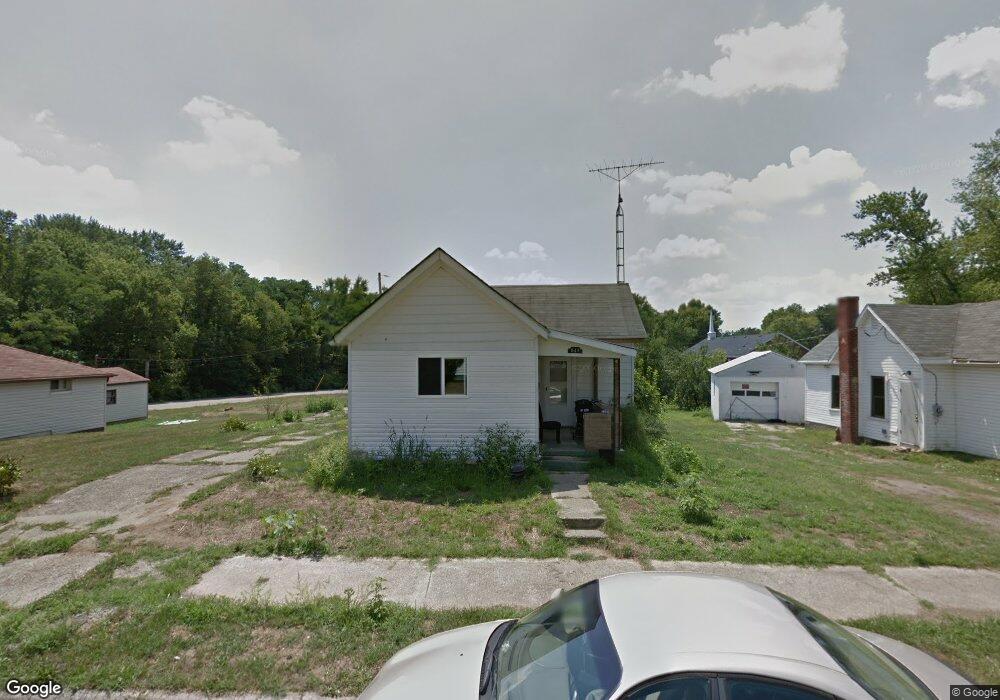
This home is located at 947 E 2nd St, Xenia, OH 45385 and is currently estimated at $68,000, approximately $86 per square foot. 947 E 2nd St is a home located in Greene County with nearby schools including Xenia High School, Summit Academy Community School for Alternative Learners - Xenia, and Legacy Christian Academy.
Ownership History
Date
Name
Owned For
Owner Type
Purchase Details
Closed on
Apr 24, 2008
Sold by
Wells Fargo Financial Ohio 1 Inc
Bought by
Day Thomas W
Current Estimated Value
Purchase Details
Closed on
Oct 4, 2007
Sold by
Channels Jerry D and Channels Larry Lee
Bought by
Wells Fargo Financial Ohio 1 Inc
Purchase Details
Closed on
Jan 2, 1998
Sold by
Byrd Monroe M
Bought by
Channels Larry Lee and Channels Jerry D
Create a Home Valuation Report for This Property
The Home Valuation Report is an in-depth analysis detailing your home's value as well as a comparison with similar homes in the area
Home Values in the Area
Average Home Value in this Area
Purchase History
| Date | Buyer | Sale Price | Title Company |
|---|---|---|---|
| Day Thomas W | $10,000 | First American Title Ins | |
| Wells Fargo Financial Ohio 1 Inc | $30,000 | None Available | |
| Channels Larry Lee | $18,000 | -- |
Source: Public Records
Tax History
| Year | Tax Paid | Tax Assessment Tax Assessment Total Assessment is a certain percentage of the fair market value that is determined by local assessors to be the total taxable value of land and additions on the property. | Land | Improvement |
|---|---|---|---|---|
| 2024 | $589 | $13,520 | $3,300 | $10,220 |
| 2023 | $579 | $13,520 | $3,300 | $10,220 |
| 2022 | $506 | $10,080 | $3,000 | $7,080 |
| 2021 | $512 | $10,080 | $3,000 | $7,080 |
| 2020 | $491 | $10,080 | $3,000 | $7,080 |
| 2019 | $458 | $8,850 | $2,890 | $5,960 |
| 2018 | $460 | $8,850 | $2,890 | $5,960 |
| 2017 | $454 | $8,850 | $2,890 | $5,960 |
| 2016 | $454 | $8,580 | $2,890 | $5,690 |
| 2015 | $455 | $8,580 | $2,890 | $5,690 |
| 2014 | $436 | $8,580 | $2,890 | $5,690 |
Source: Public Records
Map
Nearby Homes
Your Personal Tour Guide
Ask me questions while you tour the home.