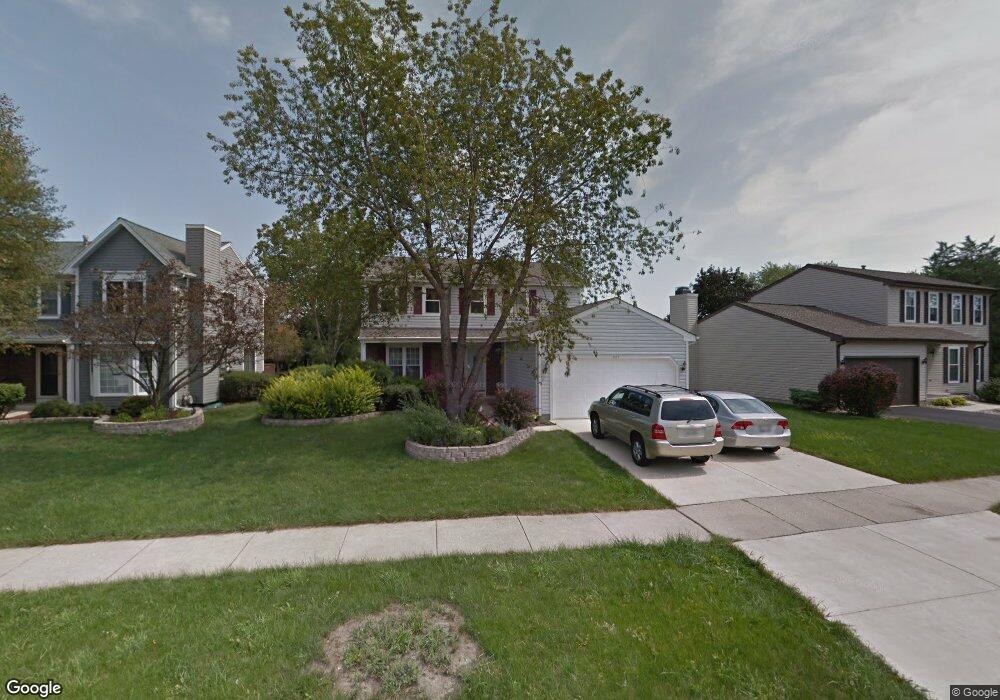
947 Jameson Way Westmont, IL 60559
South Westmont NeighborhoodEstimated Value: $451,458 - $601,000
--
Bed
1
Bath
1,496
Sq Ft
$342/Sq Ft
Est. Value
About This Home
This home is located at 947 Jameson Way, Westmont, IL 60559 and is currently estimated at $511,865, approximately $342 per square foot. 947 Jameson Way is a home located in DuPage County with nearby schools including Holmes Elementary School, Maercker Elementary School, and Westview Hills Middle School.
Ownership History
Date
Name
Owned For
Owner Type
Purchase Details
Closed on
Jun 14, 2013
Sold by
Young Susan A and Young Terry T
Bought by
Young Terry T and Young Susan A
Current Estimated Value
Home Financials for this Owner
Home Financials are based on the most recent Mortgage that was taken out on this home.
Original Mortgage
$100,000
Outstanding Balance
$21,995
Interest Rate
3.12%
Mortgage Type
New Conventional
Estimated Equity
$489,870
Purchase Details
Closed on
Jul 23, 2001
Sold by
Wang Zhong G and Zhou Jia
Bought by
Young Terry T and Young Susan A
Home Financials for this Owner
Home Financials are based on the most recent Mortgage that was taken out on this home.
Original Mortgage
$160,000
Interest Rate
7.14%
Purchase Details
Closed on
May 23, 2000
Sold by
Isaacson Michael S and Isaacson Donna L
Bought by
Wang Zhong G and Zhou Jia
Home Financials for this Owner
Home Financials are based on the most recent Mortgage that was taken out on this home.
Original Mortgage
$177,225
Interest Rate
7.37%
Create a Home Valuation Report for This Property
The Home Valuation Report is an in-depth analysis detailing your home's value as well as a comparison with similar homes in the area
Home Values in the Area
Average Home Value in this Area
Purchase History
| Date | Buyer | Sale Price | Title Company |
|---|---|---|---|
| Young Terry T | -- | Fidelity National Title Insu | |
| Young Terry T | $228,000 | First American Title | |
| Wang Zhong G | $208,000 | First American Title Ins |
Source: Public Records
Mortgage History
| Date | Status | Borrower | Loan Amount |
|---|---|---|---|
| Open | Young Terry T | $100,000 | |
| Closed | Young Terry T | $160,000 | |
| Previous Owner | Wang Zhong G | $177,225 | |
| Closed | Wang Zhong G | $10,425 |
Source: Public Records
Tax History Compared to Growth
Tax History
| Year | Tax Paid | Tax Assessment Tax Assessment Total Assessment is a certain percentage of the fair market value that is determined by local assessors to be the total taxable value of land and additions on the property. | Land | Improvement |
|---|---|---|---|---|
| 2024 | $8,325 | $136,627 | $45,187 | $91,440 |
| 2023 | $7,955 | $125,600 | $41,540 | $84,060 |
| 2022 | $7,653 | $120,070 | $39,720 | $80,350 |
| 2021 | $7,392 | $118,710 | $39,270 | $79,440 |
| 2020 | $7,248 | $116,360 | $38,490 | $77,870 |
| 2019 | $7,006 | $111,650 | $36,930 | $74,720 |
| 2018 | $6,242 | $100,760 | $43,260 | $57,500 |
| 2017 | $5,920 | $96,960 | $41,630 | $55,330 |
| 2016 | $5,809 | $92,540 | $39,730 | $52,810 |
| 2015 | $5,732 | $87,060 | $37,380 | $49,680 |
| 2014 | $6,000 | $90,050 | $36,340 | $53,710 |
| 2013 | $5,817 | $89,630 | $36,170 | $53,460 |
Source: Public Records
Map
Nearby Homes
- 263 Deming Place
- 1017 Fordham Way
- 1040 Longford Ct
- 1205 Charleston Ct Unit 1205
- 6234 Western Ave
- 6039 Bentley Ave
- 12 James Dr
- 223 E 56th St
- 500 S Wilmette Ave
- 6340 Tennessee Ave
- 6200 Clarendon Hills (Lot 3) Rd
- 5735 Virginia Ave
- 5848 Clarendon Hills Rd
- 5865 Alabama Ave
- 824 High Ridge Ct
- 511 S Cass Ave
- 303 Reserve Cir
- 47 W Pier Dr Unit 102
- 55 W 64th St Unit 202
- 107 65th Lake Dr Unit 202
- 951 Jameson Way
- 943 Jameson Way
- 939 Jameson Way
- 955 Jameson Way
- 255 Deming Place
- 259 Deming Place
- 251 Deming Place
- 225 Heath Place
- 959 Jameson Way
- 935 Jameson Way
- 946 Jameson Way
- 950 Jameson Way
- 247 Deming Place
- 954 Jameson Way
- 963 Jameson Way
- 267 Deming Place
- 243 Deming Place
- 221 Heath Place
- 224 Heath Place
- 235 Deming Place