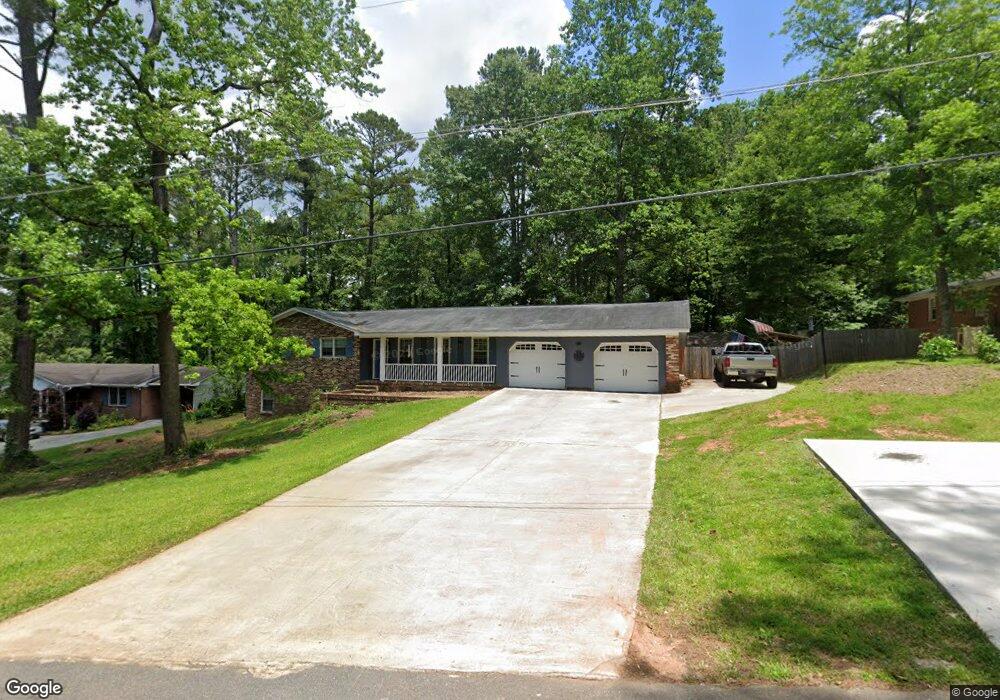
947 Matthews Dr Macon, GA 31210
Estimated Value: $181,000 - $217,000
3
Beds
2
Baths
1,378
Sq Ft
$144/Sq Ft
Est. Value
About This Home
This home is located at 947 Matthews Dr, Macon, GA 31210 and is currently estimated at $198,104, approximately $143 per square foot. 947 Matthews Dr is a home located in Bibb County with nearby schools including Lane Elementary School, Howard Middle School, and Howard High School.
Ownership History
Date
Name
Owned For
Owner Type
Purchase Details
Closed on
Jul 26, 2021
Sold by
Andrews Christopher Lee
Bought by
Andrews Christopher Lee and Andrews Rohonda Hughes
Current Estimated Value
Home Financials for this Owner
Home Financials are based on the most recent Mortgage that was taken out on this home.
Original Mortgage
$102,879
Outstanding Balance
$92,969
Interest Rate
2.78%
Estimated Equity
$105,136
Purchase Details
Closed on
May 22, 2020
Sold by
Andrews Rhonda Hughes
Bought by
Andrews Christopher Lee
Purchase Details
Closed on
Dec 18, 2019
Sold by
Andrews Otis L and Andrews Deirdre P
Bought by
Andrews Christopher Lee and Andrews Rhonda Hughes
Purchase Details
Closed on
May 21, 1999
Sold by
Andrews Otis L
Bought by
Andrews Otis L and Andrews Deirdre P
Create a Home Valuation Report for This Property
The Home Valuation Report is an in-depth analysis detailing your home's value as well as a comparison with similar homes in the area
Home Values in the Area
Average Home Value in this Area
Purchase History
| Date | Buyer | Sale Price | Title Company |
|---|---|---|---|
| Andrews Christopher Lee | -- | None Available | |
| Andrews Christopher Lee | -- | None Available | |
| Andrews Christopher Lee | $50,000 | None Available | |
| Andrews Otis L | -- | -- |
Source: Public Records
Mortgage History
| Date | Status | Borrower | Loan Amount |
|---|---|---|---|
| Open | Andrews Christopher Lee | $102,879 |
Source: Public Records
Tax History Compared to Growth
Tax History
| Year | Tax Paid | Tax Assessment Tax Assessment Total Assessment is a certain percentage of the fair market value that is determined by local assessors to be the total taxable value of land and additions on the property. | Land | Improvement |
|---|---|---|---|---|
| 2025 | $1,342 | $61,597 | $14,300 | $47,297 |
| 2024 | $1,356 | $60,408 | $14,300 | $46,108 |
| 2023 | $1,406 | $54,463 | $14,300 | $40,163 |
| 2022 | $1,688 | $55,746 | $6,846 | $48,900 |
| 2021 | $1,662 | $50,746 | $6,572 | $44,174 |
| 2020 | $1,619 | $48,709 | $6,298 | $42,411 |
| 2019 | $1,609 | $41,090 | $6,024 | $35,066 |
| 2018 | $2,643 | $41,090 | $6,024 | $35,066 |
| 2017 | $1,462 | $39,034 | $6,024 | $33,010 |
| 2016 | $1,108 | $39,034 | $6,024 | $33,010 |
| 2015 | $1,566 | $39,034 | $6,024 | $33,010 |
| 2014 | $622 | $39,582 | $6,572 | $33,010 |
Source: Public Records
Map
Nearby Homes
- 938 Lundy Terrace
- 880 Winchester Cir
- 1197 Matthews Place
- 161 Ten Knolls Dr
- 1246 Newport Rd
- 627 Lokchapee Ridge
- 636 Lokchapee Ridge
- 753 Lokchapee Dr
- 731 Lokchapee Dr
- 1161 Ousley Place
- 770 Windsor Rd
- 3500 Northside Dr
- 3602 Northside Dr
- 859 Forest Lake Dr S
- 3622 Northside Dr
- 3640 Northside Dr
- 648 Willow Creek Dr
- 740 Valley Trail
- 621 Forest Hill Rd
- 3678 Northside Dr
- 937 Matthews Dr
- 955 Matthews Dr
- 755 Glencove Dr
- 929 Matthews Dr
- 767 Glencove Dr
- 940 Matthews Dr
- 948 Matthews Dr
- 741 Glencove Dr
- 777 Glencove Dr
- 930 Matthews Dr
- 919 Matthews Dr
- 954 Matthews Dr
- 754 Dogwood Cir
- 965 Matthews Dr
- 764 Dogwood Cir
- 964 Matthews Dr
- 744 Dogwood Cir
- 911 Matthews Dr
- 729 Glencove Dr
- 754 Glencove Dr