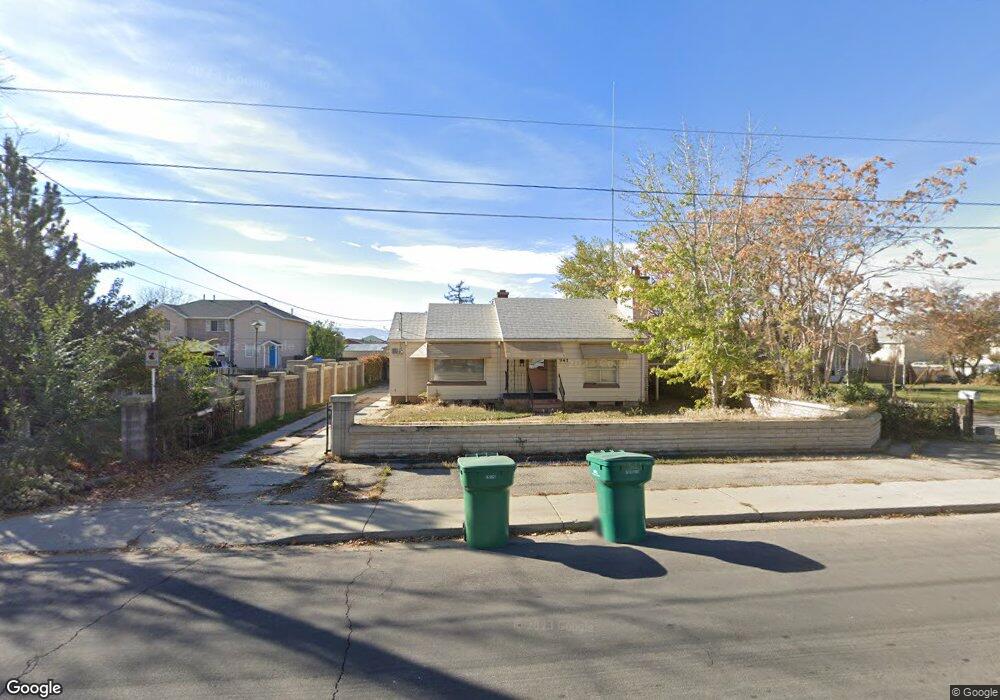
947 N 100 W Orem, UT 84057
Windsor NeighborhoodEstimated Value: $460,000 - $608,217
2
Beds
2
Baths
1,896
Sq Ft
$282/Sq Ft
Est. Value
About This Home
This home is located at 947 N 100 W, Orem, UT 84057 and is currently estimated at $533,804, approximately $281 per square foot. 947 N 100 W is a home located in Utah County with nearby schools including Windsor School, Canyon View Junior High School, and Timpanogos High School.
Ownership History
Date
Name
Owned For
Owner Type
Purchase Details
Closed on
Nov 2, 2010
Sold by
Nielsen Landon C and Nielsen Steve
Bought by
Nielsen Landon C
Current Estimated Value
Home Financials for this Owner
Home Financials are based on the most recent Mortgage that was taken out on this home.
Original Mortgage
$137,100
Outstanding Balance
$90,272
Interest Rate
4.23%
Mortgage Type
New Conventional
Estimated Equity
$443,532
Purchase Details
Closed on
Dec 23, 2003
Sold by
Peterson Betty Lue Jensen
Bought by
Nielsen Landon C and Nielsen Steve
Create a Home Valuation Report for This Property
The Home Valuation Report is an in-depth analysis detailing your home's value as well as a comparison with similar homes in the area
Home Values in the Area
Average Home Value in this Area
Purchase History
| Date | Buyer | Sale Price | Title Company |
|---|---|---|---|
| Nielsen Landon C | -- | Atlas Title Salt Lake | |
| Nielsen Landon C | -- | Atlas Title Salt Lake | |
| Nielsen Landon C | -- | Utah Standard Title |
Source: Public Records
Mortgage History
| Date | Status | Borrower | Loan Amount |
|---|---|---|---|
| Open | Nielsen Landon C | $137,100 | |
| Closed | Nielsen Landon C | $137,100 |
Source: Public Records
Tax History Compared to Growth
Tax History
| Year | Tax Paid | Tax Assessment Tax Assessment Total Assessment is a certain percentage of the fair market value that is determined by local assessors to be the total taxable value of land and additions on the property. | Land | Improvement |
|---|---|---|---|---|
| 2025 | $2,202 | $285,805 | $306,700 | $211,800 |
| 2024 | $2,202 | $269,260 | $0 | $0 |
| 2023 | $2,012 | $264,420 | $0 | $0 |
| 2022 | $2,150 | $496,500 | $311,500 | $185,000 |
| 2021 | $1,806 | $347,600 | $194,700 | $152,900 |
| 2020 | $1,616 | $305,700 | $155,800 | $149,900 |
| 2019 | $1,400 | $275,200 | $140,800 | $134,400 |
| 2018 | $1,299 | $244,000 | $125,800 | $118,200 |
| 2017 | $1,207 | $121,745 | $0 | $0 |
| 2016 | $1,097 | $102,020 | $0 | $0 |
| 2015 | $1,119 | $98,400 | $0 | $0 |
| 2014 | $1,018 | $89,115 | $0 | $0 |
Source: Public Records
Map
Nearby Homes