947 Royce Ave Holland, MI 49423
South Holland NeighborhoodEstimated Value: $310,000 - $364,000
4
Beds
2
Baths
1,680
Sq Ft
$196/Sq Ft
Est. Value
About This Home
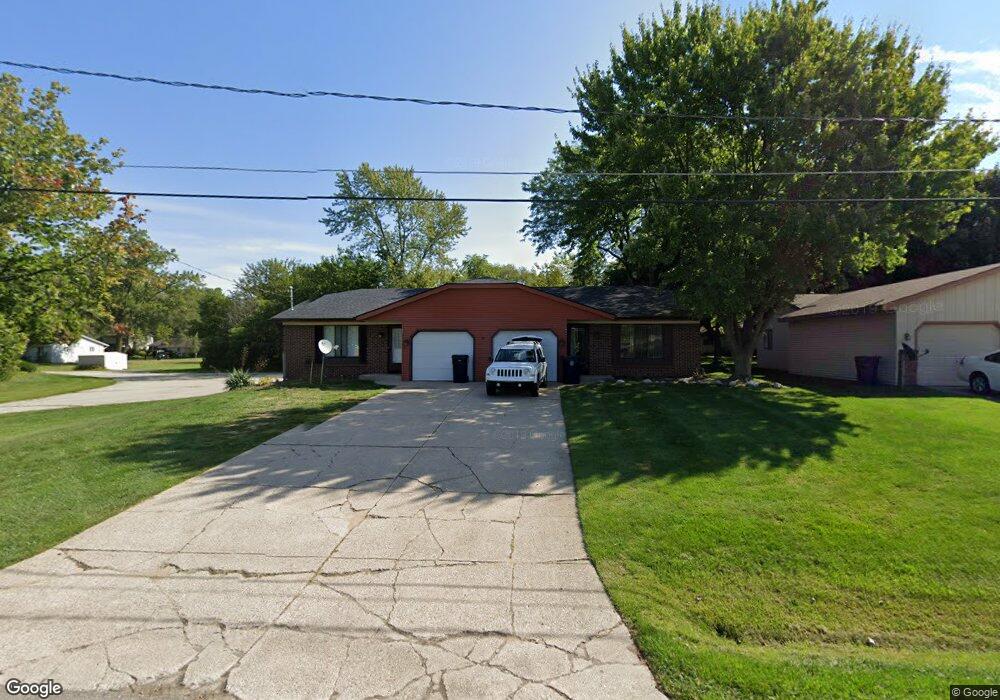
This home is located at 947 Royce Ave, Holland, MI 49423 and is currently estimated at $329,272, approximately $195 per square foot. 947 Royce Ave is a home located in Allegan County with nearby schools including Maplewood, Holland Heights Elementary, and Holland High School.
Ownership History
Date
Name
Owned For
Owner Type
Purchase Details
Closed on
Jan 7, 2025
Sold by
Kroll Irene
Bought by
Mooi Properties Llc
Current Estimated Value
Purchase Details
Closed on
Jul 15, 2020
Sold by
Genzink Rod
Bought by
Kroll Irene
Purchase Details
Closed on
Feb 1, 2005
Sold by
Big Bay Enterprises Llc
Bought by
Genzink Rod
Purchase Details
Closed on
Jan 31, 2002
Sold by
Brock Robert L and Brock Laurie A
Bought by
Big Bay Enterprises Llc
Home Financials for this Owner
Home Financials are based on the most recent Mortgage that was taken out on this home.
Original Mortgage
$112,800
Interest Rate
7.23%
Purchase Details
Closed on
Nov 10, 1998
Sold by
Looby James D
Bought by
"Big Bay Enterprises
Purchase Details
Closed on
Apr 30, 1993
Sold by
Looby James D
Create a Home Valuation Report for This Property
The Home Valuation Report is an in-depth analysis detailing your home's value as well as a comparison with similar homes in the area
Home Values in the Area
Average Home Value in this Area
Purchase History
| Date | Buyer | Sale Price | Title Company |
|---|---|---|---|
| Mooi Properties Llc | -- | None Listed On Document | |
| Mooi Properties Llc | -- | None Listed On Document | |
| Kroll Irene | $210,000 | Lakeshore Title | |
| Genzink Rod | $127,500 | -- | |
| Big Bay Enterprises Llc | -- | -- | |
| Brock Robert L | -- | -- | |
| "Big Bay Enterprises | -- | -- | |
| "Big Bay Enterprises | -- | -- | |
| -- | $90,000 | -- | |
| -- | $90,000 | -- |
Source: Public Records
Mortgage History
| Date | Status | Borrower | Loan Amount |
|---|---|---|---|
| Previous Owner | Brock Robert L | $112,800 |
Source: Public Records
Tax History
| Year | Tax Paid | Tax Assessment Tax Assessment Total Assessment is a certain percentage of the fair market value that is determined by local assessors to be the total taxable value of land and additions on the property. | Land | Improvement |
|---|---|---|---|---|
| 2025 | $5,324 | $109,100 | $16,100 | $93,000 |
| 2024 | -- | $89,000 | $13,900 | $75,100 |
| 2023 | $4,984 | $83,600 | $13,900 | $69,700 |
| 2022 | $4,756 | $79,700 | $13,900 | $65,800 |
| 2021 | $4,569 | $75,100 | $12,800 | $62,300 |
| 2020 | $2,874 | $67,200 | $12,800 | $54,400 |
| 2019 | $2,728 | $62,100 | $11,800 | $50,300 |
| 2018 | $2,728 | $54,600 | $11,800 | $42,800 |
| 2017 | $0 | $55,500 | $11,000 | $44,500 |
| 2016 | $0 | $55,500 | $11,000 | $44,500 |
| 2015 | -- | $55,500 | $11,000 | $44,500 |
| 2014 | -- | $47,200 | $7,100 | $40,100 |
| 2013 | -- | $42,500 | $7,100 | $35,400 |
Source: Public Records
Map
Nearby Homes
- 893 Harvest Dr Unit 51
- 980 Lincoln Ave
- 199 E 34th St Unit 10
- 136 E 39th St
- 421 E 32nd St
- 646 Wilshire Ct
- 634 Wilshire Ct
- 23 E 35th St
- 25 Trillium Ct Unit 6
- 188 E 26th St
- 75 Old Mill Dr Unit 21
- 125 E 22nd St
- 531 Century Ln
- 551 Century Ln
- 541 Century Ln
- 561 Century Ln
- 544 College Ave
- 28 E 23rd St
- 536 College Ave
- 866 E 24th St Unit Parcel A