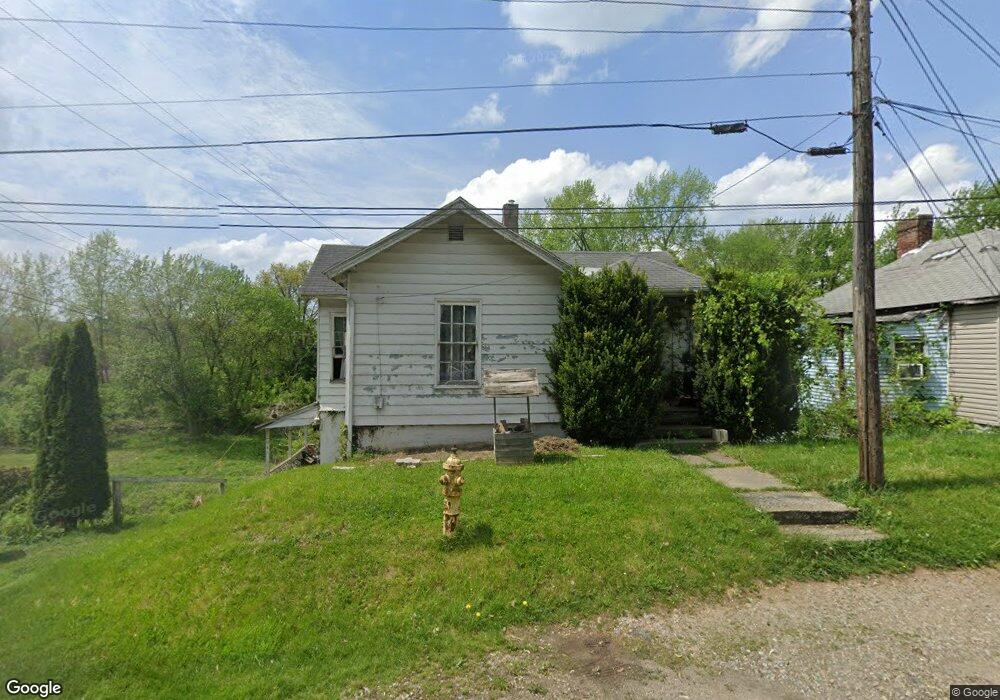
947 S 6th St Coshocton, OH 43812
Estimated Value: $61,000 - $135,000
3
Beds
1
Bath
1,092
Sq Ft
$87/Sq Ft
Est. Value
About This Home
This home is located at 947 S 6th St, Coshocton, OH 43812 and is currently estimated at $94,580, approximately $86 per square foot. 947 S 6th St is a home located in Coshocton County with nearby schools including Coshocton High School, Coshocton Opportunity School, and Sacred Heart Elementary School.
Ownership History
Date
Name
Owned For
Owner Type
Purchase Details
Closed on
Oct 3, 2023
Sold by
Cdar Holdings Llc
Bought by
Snell Dennis Dean and Snell Connie Elaine
Current Estimated Value
Purchase Details
Closed on
Sep 11, 2023
Sold by
Depalma Michael N
Bought by
Bluestone Property Holdings Llc
Purchase Details
Closed on
Mar 2, 2018
Sold by
Stevens Bruce C
Bought by
Depalma Michael N
Purchase Details
Closed on
Aug 23, 2007
Sold by
The Home Loan Savinga Bank
Bought by
Stevens Bruce C and Stevens Jodie L
Purchase Details
Closed on
Feb 9, 2007
Sold by
T & M Rentals Llc and Ralston Marty R
Bought by
The Home Loan Savings Bank
Purchase Details
Closed on
Jul 31, 2003
Bought by
T & M Rentals Llc
Purchase Details
Closed on
Jan 19, 1999
Bought by
Mcginnis Real Estate Ltd
Purchase Details
Closed on
Nov 18, 1997
Sold by
Tomak Betty L
Bought by
Mcginnis Jeffrey
Create a Home Valuation Report for This Property
The Home Valuation Report is an in-depth analysis detailing your home's value as well as a comparison with similar homes in the area
Home Values in the Area
Average Home Value in this Area
Purchase History
| Date | Buyer | Sale Price | Title Company |
|---|---|---|---|
| Snell Dennis Dean | -- | None Listed On Document | |
| Snell Dennis Dean | -- | None Listed On Document | |
| Miller Duane | $50,725 | None Listed On Document | |
| Miller Duane | $50,725 | None Listed On Document | |
| Bluestone Property Holdings Llc | $10,000 | World Class Title | |
| Depalma Michael N | $6,200 | None Available | |
| Stevens Bruce C | $4,000 | None Available | |
| The Home Loan Savings Bank | -- | None Available | |
| T & M Rentals Llc | $450,000 | -- | |
| Mcginnis Real Estate Ltd | -- | -- | |
| Mcginnis Real Estate Ltd | -- | -- | |
| Mcginnis Jeffrey | $16,800 | -- |
Source: Public Records
Tax History
| Year | Tax Paid | Tax Assessment Tax Assessment Total Assessment is a certain percentage of the fair market value that is determined by local assessors to be the total taxable value of land and additions on the property. | Land | Improvement |
|---|---|---|---|---|
| 2024 | $267 | $6,280 | $2,520 | $3,760 |
| 2023 | $267 | $4,908 | $1,936 | $2,972 |
| 2022 | $245 | $4,908 | $1,936 | $2,972 |
| 2021 | $245 | $4,908 | $1,936 | $2,972 |
| 2020 | $268 | $5,219 | $1,967 | $3,252 |
| 2019 | $271 | $5,219 | $1,967 | $3,252 |
| 2018 | $263 | $5,219 | $1,967 | $3,252 |
| 2017 | $272 | $5,090 | $1,838 | $3,252 |
| 2016 | $262 | $5,090 | $1,838 | $3,252 |
| 2015 | $156 | $5,090 | $1,838 | $3,252 |
| 2014 | $156 | $3,101 | $2,450 | $651 |
Source: Public Records
Map
Nearby Homes
- 808 Kenilworth Ave
- 227 Pine St
- 223 Pine St
- 722 John St
- 410 Pine St
- 433 S 7th St
- 510 S 8th St
- 310 S 4th St
- 1215 Denman Ave
- 333 S 9th St
- 839 Orange St
- Lot# 7, S 12th St
- 597 S 12th St
- Lot 8 Country Club Dr
- 127 Park Ave
- 1011 Adams St
- Lot 7 Country Club Dr
- Lot 2 Country Club Dr
- Lot 1 Country Club Dr
- Lot 5 Country Club Dr
Your Personal Tour Guide
Ask me questions while you tour the home.