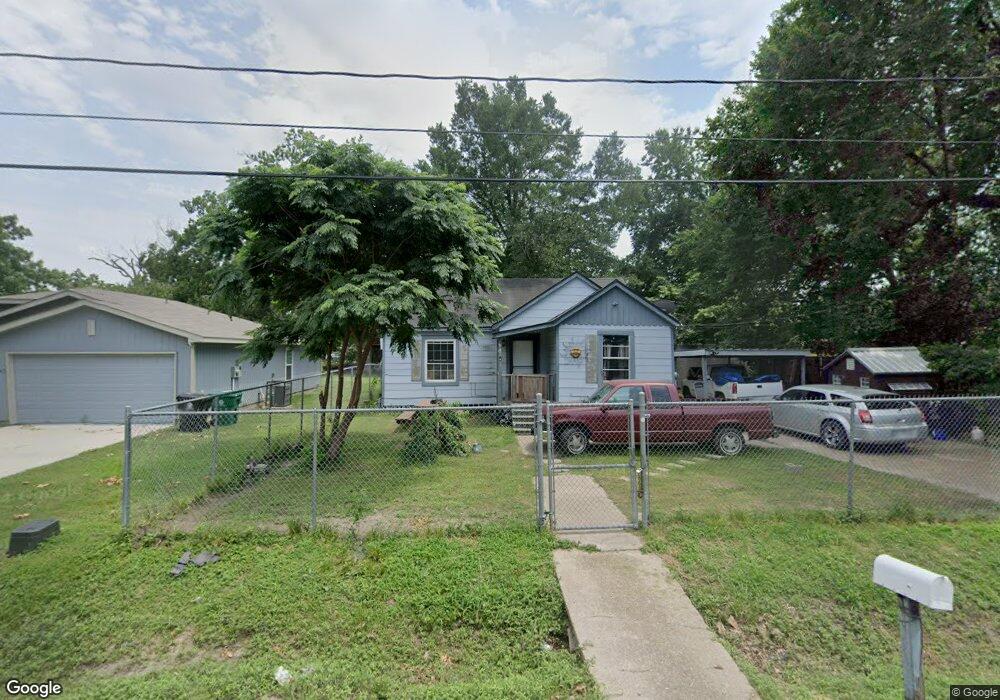
947 South Ln Houston, TX 77088
Acres Homes NeighborhoodEstimated Value: $95,000 - $165,000
2
Beds
1
Bath
913
Sq Ft
$148/Sq Ft
Est. Value
About This Home
This home is located at 947 South Ln, Houston, TX 77088 and is currently estimated at $135,288, approximately $148 per square foot. 947 South Ln is a home located in Harris County with nearby schools including Osborne Elementary School, Williams Middle, and Booker T Washington Sr High.
Ownership History
Date
Name
Owned For
Owner Type
Purchase Details
Closed on
Jun 23, 2017
Sold by
Vean Karen R and Johnson Ivroy J
Bought by
Saucedo Aracelia
Current Estimated Value
Home Financials for this Owner
Home Financials are based on the most recent Mortgage that was taken out on this home.
Original Mortgage
$57,800
Outstanding Balance
$48,078
Interest Rate
4.02%
Mortgage Type
New Conventional
Estimated Equity
$87,210
Purchase Details
Closed on
Jun 13, 2017
Sold by
Vean Karen R and Johnson Ola V
Bought by
Vean Karen R
Home Financials for this Owner
Home Financials are based on the most recent Mortgage that was taken out on this home.
Original Mortgage
$57,800
Outstanding Balance
$48,078
Interest Rate
4.02%
Mortgage Type
New Conventional
Estimated Equity
$87,210
Purchase Details
Closed on
Aug 13, 2016
Sold by
Johnson Glenda Denise
Bought by
Vean Karnen
Purchase Details
Closed on
Sep 12, 2002
Sold by
Johnson Ola V
Bought by
Johnson Glenda D
Create a Home Valuation Report for This Property
The Home Valuation Report is an in-depth analysis detailing your home's value as well as a comparison with similar homes in the area
Home Values in the Area
Average Home Value in this Area
Purchase History
| Date | Buyer | Sale Price | Title Company |
|---|---|---|---|
| Saucedo Aracelia | -- | First American Title | |
| Vean Karen R | -- | First American Title | |
| Vean Karnen | -- | None Available | |
| Johnson Glenda D | -- | -- |
Source: Public Records
Mortgage History
| Date | Status | Borrower | Loan Amount |
|---|---|---|---|
| Open | Saucedo Aracelia | $57,800 |
Source: Public Records
Tax History Compared to Growth
Tax History
| Year | Tax Paid | Tax Assessment Tax Assessment Total Assessment is a certain percentage of the fair market value that is determined by local assessors to be the total taxable value of land and additions on the property. | Land | Improvement |
|---|---|---|---|---|
| 2025 | $2,195 | $107,427 | $73,800 | $33,627 |
| 2024 | $2,195 | $104,917 | $73,800 | $31,117 |
| 2023 | $2,195 | $105,587 | $73,800 | $31,787 |
| 2022 | $2,060 | $93,574 | $57,600 | $35,974 |
| 2021 | $1,698 | $72,851 | $37,800 | $35,051 |
| 2020 | $1,602 | $66,168 | $32,400 | $33,768 |
| 2019 | $1,609 | $63,577 | $28,800 | $34,777 |
| 2018 | $1,240 | $49,015 | $16,200 | $32,815 |
| 2017 | $1,055 | $41,738 | $10,800 | $30,938 |
| 2016 | $822 | $41,738 | $10,800 | $30,938 |
| 2015 | -- | $29,569 | $10,800 | $18,769 |
| 2014 | -- | $29,569 | $10,800 | $18,769 |
Source: Public Records
Map
Nearby Homes
- 936 - A&B South Ln
- 954A Junell St
- 934 South Ln
- 990 Marjorie St
- 932 S Lane Unit A-B Houston
- 1061 South Ln
- 991 Reverend b j Lewis Dr
- 8324 Williamsdell St
- 8322 Williamsdell St
- 8320 Williamsdell St
- 1031 North Ln
- 1033 North Ln
- 8310 Williamsdell St
- 907 Ferguson Way
- 961 Ringold St
- 830 Ringold St
- 958 Ringold St
- 905 Ferguson Way
- 906 Fortune St
- 911 Fortune St
- 943 South Ln
- 943 S Lane Ln
- 952 Marjorie St
- 956 Marjorie St
- 972 Marjorie St
- 939 South Ln
- 948 South Ln
- 958 South Ln
- 944 South Ln
- 949 Marjorie St
- 974 Marjorie St
- 935 South Ln
- TBD Marjori St
- 936 South Ln Unit A
- 936 South Ln
- 965 Marjorie St
- 957 Marjorie St
- 931 South Ln
- 951 Reverend b j Lewis Dr
- 961 Marjorie St