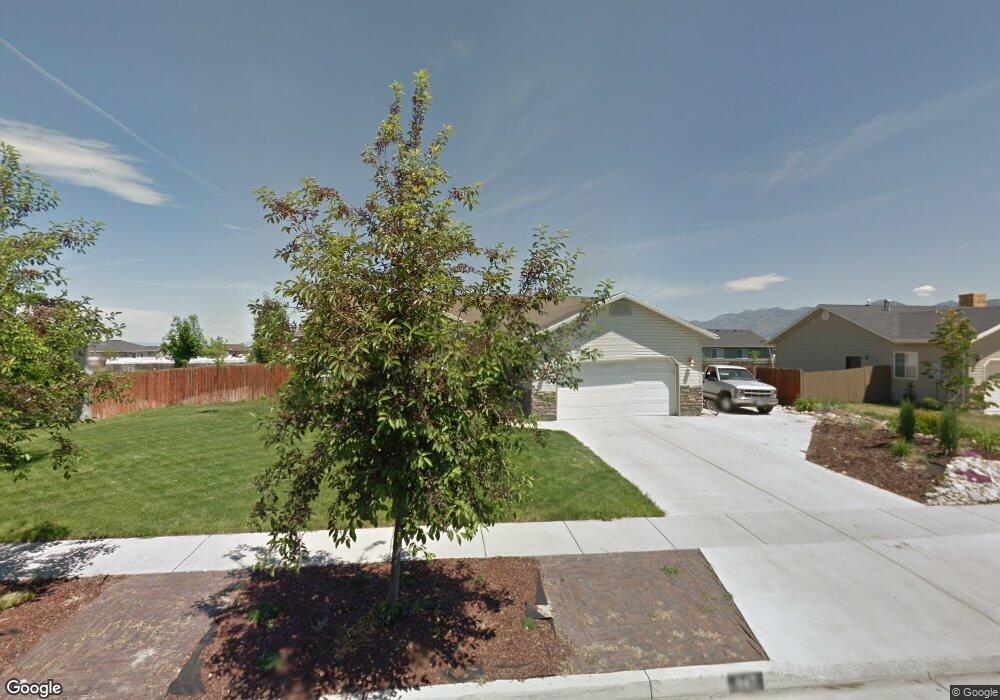
947 W 2730 S Nibley, UT 84321
Estimated Value: $407,000 - $436,000
4
Beds
2
Baths
1,558
Sq Ft
$272/Sq Ft
Est. Value
About This Home
This home is located at 947 W 2730 S, Nibley, UT 84321 and is currently estimated at $423,421, approximately $271 per square foot. 947 W 2730 S is a home located in Cache County with nearby schools including Nibley School, Spring Creek Middle School, and South Cache Middle School.
Ownership History
Date
Name
Owned For
Owner Type
Purchase Details
Closed on
Jan 23, 2020
Sold by
Montufar Jesse F and Montufar Jessica
Bought by
Westre Thomas G and Westre Sylvia
Current Estimated Value
Home Financials for this Owner
Home Financials are based on the most recent Mortgage that was taken out on this home.
Original Mortgage
$250,600
Outstanding Balance
$221,500
Interest Rate
3.73%
Mortgage Type
VA
Estimated Equity
$201,921
Purchase Details
Closed on
Dec 13, 2017
Sold by
Chavez Fernando
Bought by
Montufar Jesse F and Montufar Jessica
Home Financials for this Owner
Home Financials are based on the most recent Mortgage that was taken out on this home.
Original Mortgage
$215,151
Interest Rate
3.94%
Mortgage Type
New Conventional
Purchase Details
Closed on
Sep 20, 2013
Sold by
Ungerman Sterling K and Ungerman Amanda
Bought by
Chavez Fernando
Home Financials for this Owner
Home Financials are based on the most recent Mortgage that was taken out on this home.
Original Mortgage
$164,957
Interest Rate
5.25%
Mortgage Type
FHA
Purchase Details
Closed on
Jul 6, 2005
Sold by
Neighborhood Nonprofit Housing Corporati
Bought by
Ungerman Sterling K and Ungerman Amanda
Home Financials for this Owner
Home Financials are based on the most recent Mortgage that was taken out on this home.
Original Mortgage
$2,000
Interest Rate
5.58%
Mortgage Type
Purchase Money Mortgage
Create a Home Valuation Report for This Property
The Home Valuation Report is an in-depth analysis detailing your home's value as well as a comparison with similar homes in the area
Home Values in the Area
Average Home Value in this Area
Purchase History
| Date | Buyer | Sale Price | Title Company |
|---|---|---|---|
| Westre Thomas G | -- | American Secure Title Logan | |
| Montufar Jesse F | -- | -- | |
| Chavez Fernando | -- | Cache Title Logan | |
| Ungerman Sterling K | -- | Cache Title Company |
Source: Public Records
Mortgage History
| Date | Status | Borrower | Loan Amount |
|---|---|---|---|
| Open | Westre Thomas G | $250,600 | |
| Previous Owner | Montufar Jesse F | $215,151 | |
| Previous Owner | Chavez Fernando | $164,957 | |
| Previous Owner | Ungerman Sterling K | $2,000 |
Source: Public Records
Tax History Compared to Growth
Tax History
| Year | Tax Paid | Tax Assessment Tax Assessment Total Assessment is a certain percentage of the fair market value that is determined by local assessors to be the total taxable value of land and additions on the property. | Land | Improvement |
|---|---|---|---|---|
| 2025 | $1,443 | $191,310 | $0 | $0 |
| 2024 | $1,541 | $191,790 | $0 | $0 |
| 2023 | $1,611 | $187,775 | $0 | $0 |
| 2022 | $1,677 | $187,775 | $0 | $0 |
| 2021 | $1,646 | $286,130 | $65,000 | $221,130 |
| 2020 | $1,417 | $234,510 | $65,000 | $169,510 |
| 2019 | $1,486 | $234,510 | $65,000 | $169,510 |
| 2018 | $1,250 | $192,400 | $45,000 | $147,400 |
| 2017 | $1,207 | $98,450 | $0 | $0 |
| 2016 | $1,220 | $98,450 | $0 | $0 |
| 2015 | $1,061 | $86,145 | $0 | $0 |
| 2014 | $1,037 | $86,145 | $0 | $0 |
| 2013 | -- | $86,145 | $0 | $0 |
Source: Public Records
Map
Nearby Homes