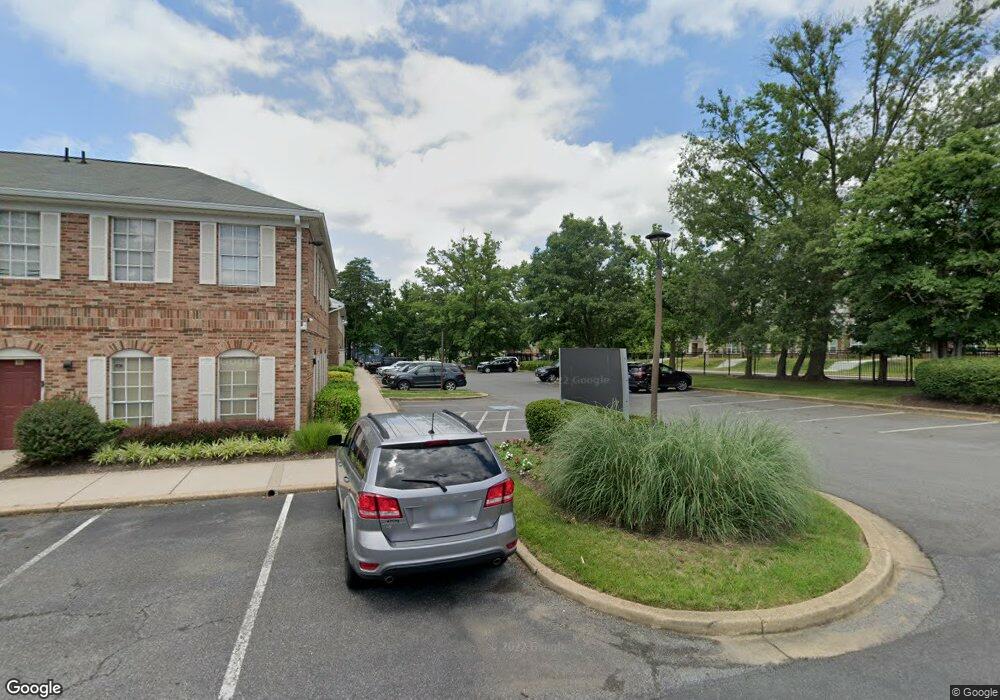
9470 Annapolis Rd Unit 102 Lanham, MD 20706
Estimated Value: $169,838
Studio
--
Bath
658
Sq Ft
$258/Sq Ft
Est. Value
About This Home
This home is located at 9470 Annapolis Rd Unit 102, Lanham, MD 20706 and is currently estimated at $169,838, approximately $258 per square foot. 9470 Annapolis Rd Unit 102 is a home located in Prince George's County with nearby schools including Seabrook Elementary School, Thomas Johnson Middle School, and Duval High School.
Ownership History
Date
Name
Owned For
Owner Type
Purchase Details
Closed on
Nov 2, 2018
Sold by
Gharraian Effie and Effie Ghaffarian Revocable Tru
Bought by
Pascan Atemnkeng
Current Estimated Value
Home Financials for this Owner
Home Financials are based on the most recent Mortgage that was taken out on this home.
Original Mortgage
$80,500
Outstanding Balance
$70,644
Interest Rate
4.8%
Mortgage Type
Commercial
Estimated Equity
$99,194
Purchase Details
Closed on
Nov 1, 2006
Sold by
Ghaffarian Effie and Ghaffarian Ahmad
Bought by
Ghaffarian Effie and Ghaffarian Ron
Purchase Details
Closed on
Oct 31, 2006
Sold by
Ghaffarian Effie and Ghaffarian Ahmad
Bought by
Ghaffarian Effie and Ghaffarian Ron
Purchase Details
Closed on
May 6, 2003
Sold by
Chesley William F
Bought by
Ghaffarian Effie and Ghaffarian Ahmad
Purchase Details
Closed on
Jun 5, 1979
Sold by
Jameson Beulah A
Bought by
Chesley William F
Create a Home Valuation Report for This Property
The Home Valuation Report is an in-depth analysis detailing your home's value as well as a comparison with similar homes in the area
Home Values in the Area
Average Home Value in this Area
Purchase History
| Date | Buyer | Sale Price | Title Company |
|---|---|---|---|
| Pascan Atemnkeng | $115,000 | Brennan Title Co | |
| Ghaffarian Effie | -- | -- | |
| Ghaffarian Effie | -- | -- | |
| Ghaffarian Effie | $300,000 | -- | |
| Chesley William F | $143,500 | -- |
Source: Public Records
Mortgage History
| Date | Status | Borrower | Loan Amount |
|---|---|---|---|
| Open | Pascan Atemnkeng | $80,500 |
Source: Public Records
Tax History
| Year | Tax Paid | Tax Assessment Tax Assessment Total Assessment is a certain percentage of the fair market value that is determined by local assessors to be the total taxable value of land and additions on the property. | Land | Improvement |
|---|---|---|---|---|
| 2025 | $1,748 | $117,567 | -- | -- |
| 2024 | $1,748 | $113,033 | -- | -- |
| 2023 | $1,680 | $108,500 | $37,900 | $70,600 |
| 2022 | $1,550 | $99,733 | $0 | $0 |
| 2021 | $1,419 | $90,967 | $0 | $0 |
| 2020 | $2,578 | $82,200 | $28,700 | $53,500 |
| 2019 | $1,161 | $81,100 | $0 | $0 |
| 2018 | $1,256 | $80,000 | $0 | $0 |
| 2017 | $1,240 | $78,900 | $0 | $0 |
| 2016 | -- | $78,900 | $0 | $0 |
| 2015 | $1,684 | $78,900 | $0 | $0 |
| 2014 | $1,684 | $111,800 | $0 | $0 |
Source: Public Records
Map
Nearby Homes
- 5554 Lanteen St Unit 1105
- 9712 Vang Dr
- 5513 Lanteen St
- 9616 Block St
- 9603 Beachwood Ave
- 9603 Woodland Ave
- 9434 Dubarry Ave
- 9309 Kimbark Ave
- 9524 Dubarry Ave
- 9805 Walnut Ave
- 10102 Ellard Dr
- 5904 Justina Dr
- 6003 Shepherd Ln
- 0 Franklin Ave Unit MDPG2190164
- 10133 Ellard Dr
- 5613 Gregory Dr
- 4706 Cooks Hill Rd Unit 6 TO BE BUILT ELDER
- 9226 Fowler Ln
- 4703 Cooks Hill Rd Unit 13
- 9202 Cooks Point Ct Unit 15 MODEL HOME
- 9470 Annapolis Rd Unit 214
- 9470 Annapolis Rd Unit 307
- 9470 Annapolis Rd Unit 416-A
- 9470 Annapolis Rd Unit 111
- 9470 Annapolis Rd Unit 312
- 9470 Annapolis Rd Unit 109
- 9470 Annapolis Rd Unit 118
- 9470 Annapolis Rd Unit 314
- 9470 Annapolis Rd Unit 208
- 9470 Annapolis Rd Unit 318
- 9470 Annapolis Rd Unit 317
- 9470 Annapolis Rd Unit 317-318
- 9470 Annapolis Rd Unit 313
- 9470 Annapolis Rd Unit 225
- 9470 Annapolis Rd Unit 212
- 9470 Annapolis Rd Unit 401
- 9470 Annapolis Rd Unit 108
- 9470 Annapolis Rd Unit 223
- 9470 Annapolis Rd Unit 224
- 9470 Annapolis Rd Unit 306
Your Personal Tour Guide
Ask me questions while you tour the home.