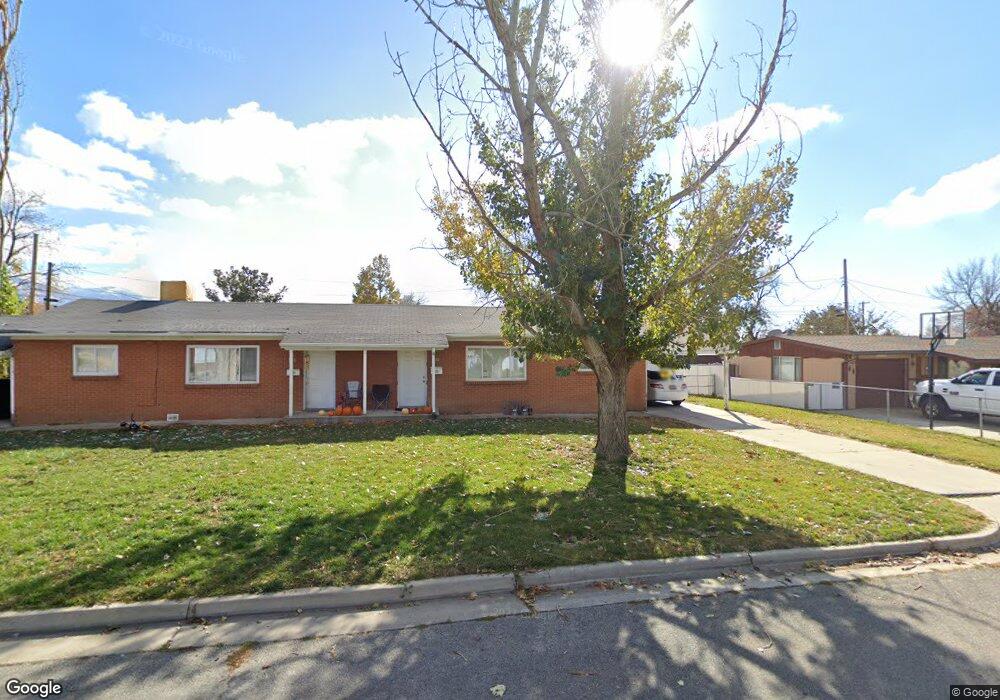
948 Egan St Layton, UT 84041
Estimated Value: $290,000 - $381,000
2
Beds
1
Bath
838
Sq Ft
$404/Sq Ft
Est. Value
About This Home
This home is located at 948 Egan St, Layton, UT 84041 and is currently estimated at $338,819, approximately $404 per square foot. 948 Egan St is a home with nearby schools including Whitesides Elementary School, Central Davis Junior High School, and Layton High School.
Ownership History
Date
Name
Owned For
Owner Type
Purchase Details
Closed on
Jul 28, 2008
Sold by
Ashment Roger
Bought by
Ashment Roger B
Current Estimated Value
Purchase Details
Closed on
Sep 26, 2007
Sold by
Vanderbeek James and Vanderbeek Sharla
Bought by
Ashment Roger
Purchase Details
Closed on
May 28, 2004
Sold by
Pearson Kenneth and Pearson Sharon L
Bought by
Vanderbreek James and Vanderbreek Sharla
Home Financials for this Owner
Home Financials are based on the most recent Mortgage that was taken out on this home.
Original Mortgage
$109,750
Interest Rate
6.25%
Mortgage Type
Purchase Money Mortgage
Purchase Details
Closed on
Nov 16, 1999
Sold by
Loghry Kaylene and Loghry Harlen
Bought by
Pearson Kenneth and Pearson Sharon L
Home Financials for this Owner
Home Financials are based on the most recent Mortgage that was taken out on this home.
Original Mortgage
$61,500
Interest Rate
7.82%
Mortgage Type
Seller Take Back
Create a Home Valuation Report for This Property
The Home Valuation Report is an in-depth analysis detailing your home's value as well as a comparison with similar homes in the area
Home Values in the Area
Average Home Value in this Area
Purchase History
| Date | Buyer | Sale Price | Title Company |
|---|---|---|---|
| Ashment Roger B | -- | None Available | |
| Ashment Roger | -- | First American Title | |
| Vanderbreek James | -- | Bonneville Title Company Inc | |
| Pearson Kenneth | -- | Weber Title Co |
Source: Public Records
Mortgage History
| Date | Status | Borrower | Loan Amount |
|---|---|---|---|
| Previous Owner | Vanderbreek James | $109,750 | |
| Previous Owner | Pearson Kenneth | $61,500 |
Source: Public Records
Tax History
| Year | Tax Paid | Tax Assessment Tax Assessment Total Assessment is a certain percentage of the fair market value that is determined by local assessors to be the total taxable value of land and additions on the property. | Land | Improvement |
|---|---|---|---|---|
| 2025 | $1,420 | $149,050 | $86,573 | $62,477 |
| 2024 | $1,368 | $144,649 | $101,732 | $42,917 |
| 2023 | $1,314 | $134,750 | $71,057 | $63,692 |
| 2022 | $1,320 | $243,000 | $119,658 | $123,342 |
| 2021 | $1,122 | $169,387 | $86,056 | $83,331 |
| 2020 | $1,093 | $158,328 | $74,997 | $83,331 |
| 2019 | $1,107 | $157,000 | $73,669 | $83,331 |
| 2018 | $1,103 | $157,000 | $73,669 | $83,331 |
| 2016 | $749 | $55,000 | $11,000 | $44,000 |
| 2015 | $827 | $56,980 | $11,000 | $45,980 |
| 2014 | $799 | $56,969 | $15,617 | $41,352 |
| 2013 | -- | $55,432 | $15,617 | $39,815 |
Source: Public Records
Map
Nearby Homes
- 187 N Talbot Dr
- 9 Colonial Ave
- 1137 Holmes Creek Ln
- 508 N Adamswood Rd
- 86 Mill Rd
- 556 N Fairfield Rd Unit A2
- 556 N Fairfield Rd Unit D1
- 556 N Fairfield Rd Unit D2
- 556 N Fairfield Rd Unit A3
- 556 N Fairfield Rd Unit D3
- 556 N Fairfield Rd Unit D4
- 556 N Fairfield Rd Unit A1
- 556 N Fairfield Rd Unit A4
- 479 N 1375 E
- 1368 E 275 S
- 149 N Fort Ln Unit 1D
- 861 E 575 N
- 1515 E Gentile St
- 617 E 405 S
- 1503 E 530 N
Your Personal Tour Guide
Ask me questions while you tour the home.