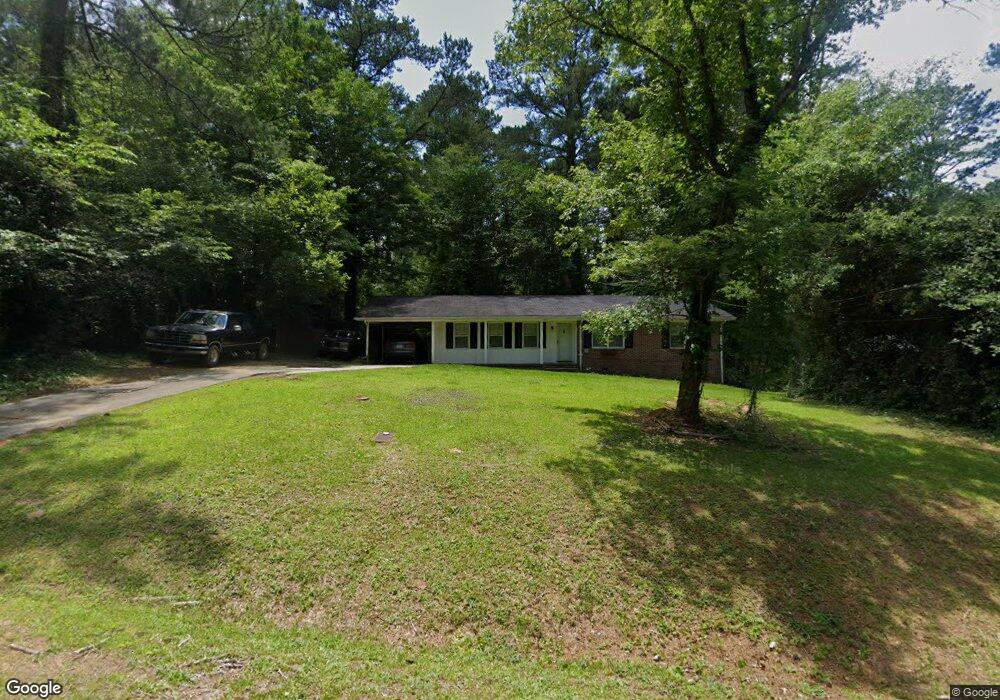
948 Matthews Dr Macon, GA 31210
Estimated Value: $161,000 - $193,000
3
Beds
2
Baths
1,326
Sq Ft
$128/Sq Ft
Est. Value
About This Home
This home is located at 948 Matthews Dr, Macon, GA 31210 and is currently estimated at $169,385, approximately $127 per square foot. 948 Matthews Dr is a home located in Bibb County with nearby schools including Lane Elementary School, Howard Middle School, and Howard High School.
Ownership History
Date
Name
Owned For
Owner Type
Purchase Details
Closed on
Mar 17, 2014
Sold by
Norris Lauren L and Tanner Lauren Leigh
Bought by
Norris Randall O
Current Estimated Value
Purchase Details
Closed on
Aug 19, 2011
Sold by
Norris Randall O
Bought by
Norris Randall O and Norris Lauren L
Purchase Details
Closed on
Apr 5, 2011
Sold by
Shiver Shannon F and Shiver April W
Bought by
Bac Home Loans Servicing Lp Fka Country
Purchase Details
Closed on
Mar 3, 1997
Bought by
Shiver Shannon F and Shiver April W
Create a Home Valuation Report for This Property
The Home Valuation Report is an in-depth analysis detailing your home's value as well as a comparison with similar homes in the area
Purchase History
| Date | Buyer | Sale Price | Title Company |
|---|---|---|---|
| Norris Randall O | -- | None Available | |
| Norris Randall O | -- | None Available | |
| Norris Randall O | -- | None Available | |
| Bac Home Loans Servicing Lp Fka Country | $71,800 | -- | |
| Federal Home Loan Mortgage Corporation | $71,775 | None Available | |
| Bac Home Loans Servicing Lp | $71,774 | None Available | |
| Shiver Shannon F | $82,000 | -- |
Source: Public Records
Tax History
| Year | Tax Paid | Tax Assessment Tax Assessment Total Assessment is a certain percentage of the fair market value that is determined by local assessors to be the total taxable value of land and additions on the property. | Land | Improvement |
|---|---|---|---|---|
| 2025 | $1,282 | $52,187 | $13,000 | $39,187 |
| 2024 | $1,300 | $51,198 | $13,000 | $38,198 |
| 2023 | $1,175 | $46,253 | $13,000 | $33,253 |
| 2022 | $1,539 | $44,460 | $5,712 | $38,748 |
| 2021 | $1,554 | $40,900 | $5,484 | $35,416 |
| 2020 | $1,524 | $39,243 | $5,255 | $33,988 |
| 2019 | $1,294 | $33,065 | $5,026 | $28,039 |
| 2018 | $2,162 | $33,065 | $5,026 | $28,039 |
| 2017 | $1,176 | $31,399 | $5,026 | $26,373 |
| 2016 | $1,086 | $31,399 | $5,026 | $26,373 |
| 2015 | $1,538 | $31,406 | $5,026 | $26,379 |
| 2014 | $1,795 | $31,863 | $5,484 | $26,379 |
Source: Public Records
Map
Nearby Homes
- 122 Lundy Ct
- 840 Balim Ct
- 1024 Normandy Rd
- 636 Lokchapee Ridge
- 610 Chastain Place
- 1161 Ousley Place
- 1209 Normandy Rd
- 859 Forest Lake Dr S
- 125 N Laura Ann Ct
- 3500 Northside Dr
- 770 Windsor Rd
- 3602 Northside Dr
- 673 Commanche Dr
- 3622 Northside Dr
- 3640 Northside Dr
- 843 Green Oak Terrace
- 673 Woodridge Dr
- 3678 Northside Dr
- 654 Willow Creek Dr
- 810 Willow Creek Dr Unit 810
- 940 Matthews Dr
- 954 Matthews Dr
- 964 Matthews Dr
- 930 Matthews Dr
- 567 Glencove Dr
- 955 Matthews Dr
- 947 Matthews Dr
- 609 Glencove Dr
- 555 Glencove Dr
- 601 Glencove Dr
- 970 Matthews Dr
- 965 Matthews Dr
- 937 Matthews Dr
- 617 Glen Cove
- 617 Glencove Dr
- 105 Matthews Ct
- 929 Matthews Dr
- 523 Glencove Dr
- 511 Glencove Dr
- 741 Glencove Dr
Your Personal Tour Guide
Ask me questions while you tour the home.