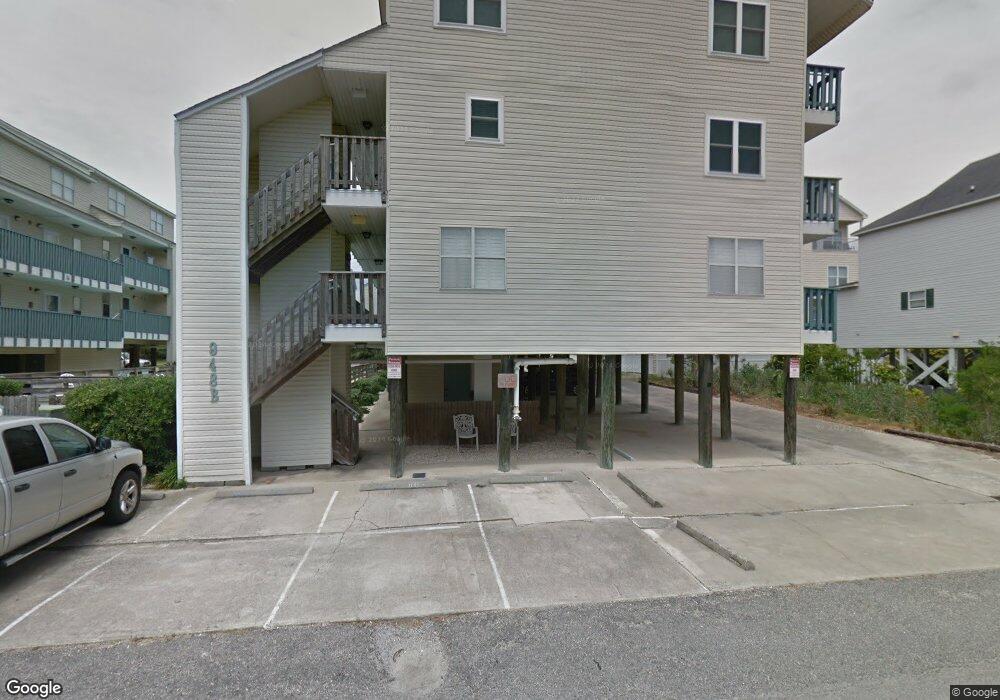
948 Perrin Dr Unit 3 North Myrtle Beach, SC 29582
Crescent Beach NeighborhoodEstimated Value: $232,000 - $334,000
2
Beds
2
Baths
938
Sq Ft
$282/Sq Ft
Est. Value
About This Home
This home is located at 948 Perrin Dr Unit 3, North Myrtle Beach, SC 29582 and is currently estimated at $264,728, approximately $282 per square foot. 948 Perrin Dr Unit 3 is a home located in Horry County with nearby schools including Ocean Drive Elementary School, North Myrtle Beach Middle School, and North Myrtle Beach High School.
Ownership History
Date
Name
Owned For
Owner Type
Purchase Details
Closed on
Dec 28, 2007
Sold by
Chaney Michael B and Chaney Cheryl W
Bought by
Mullis John E and Mullis Sylvia
Current Estimated Value
Home Financials for this Owner
Home Financials are based on the most recent Mortgage that was taken out on this home.
Original Mortgage
$147,000
Outstanding Balance
$92,256
Interest Rate
6.05%
Mortgage Type
Purchase Money Mortgage
Estimated Equity
$172,472
Purchase Details
Closed on
Oct 22, 2002
Sold by
Corbisiero Deborah A and Corbisiero Amii M
Bought by
Chaney Michael B and Chaney Cheryl W
Home Financials for this Owner
Home Financials are based on the most recent Mortgage that was taken out on this home.
Original Mortgage
$15,577
Interest Rate
5.93%
Mortgage Type
Unknown
Purchase Details
Closed on
Mar 29, 2001
Sold by
Street Richard D and Street Gina M
Bought by
Corbisiero Amii M and Corbisiero Deborah A
Purchase Details
Closed on
Apr 24, 2000
Sold by
Auman Howard Frank and Auman Amanda L
Bought by
Street Richard D and Street Gina M
Create a Home Valuation Report for This Property
The Home Valuation Report is an in-depth analysis detailing your home's value as well as a comparison with similar homes in the area
Home Values in the Area
Average Home Value in this Area
Purchase History
| Date | Buyer | Sale Price | Title Company |
|---|---|---|---|
| Mullis John E | $167,000 | Attorney | |
| Chaney Michael B | $107,000 | -- | |
| Corbisiero Amii M | -- | -- | |
| Street Richard D | $90,000 | -- |
Source: Public Records
Mortgage History
| Date | Status | Borrower | Loan Amount |
|---|---|---|---|
| Open | Mullis John E | $147,000 | |
| Previous Owner | Chaney Michael B | $15,577 | |
| Previous Owner | Chaney Michael B | $83,080 |
Source: Public Records
Tax History Compared to Growth
Tax History
| Year | Tax Paid | Tax Assessment Tax Assessment Total Assessment is a certain percentage of the fair market value that is determined by local assessors to be the total taxable value of land and additions on the property. | Land | Improvement |
|---|---|---|---|---|
| 2024 | $1,818 | $13,320 | $0 | $13,320 |
| 2023 | $1,818 | $13,650 | $0 | $13,650 |
| 2021 | $1,654 | $13,650 | $0 | $13,650 |
| 2020 | $1,636 | $13,650 | $0 | $13,650 |
| 2019 | $1,578 | $13,650 | $0 | $13,650 |
| 2018 | $0 | $11,130 | $0 | $11,130 |
| 2017 | $440 | $6,360 | $0 | $6,360 |
| 2016 | -- | $6,360 | $0 | $6,360 |
| 2015 | $1,430 | $11,130 | $0 | $11,130 |
| 2014 | $1,384 | $6,360 | $0 | $6,360 |
Source: Public Records
Map
Nearby Homes
- 931 S Ocean Blvd
- 928 Strand Ave
- 1003 S Ocean Blvd Unit 504
- 1003 S Ocean Blvd Unit 505
- 1005 S Ocean Blvd Unit 704
- 918 Strand Ave
- 1000 Strand Ave
- 1002 Perrin Dr
- 1011 S Ocean Blvd Unit 202
- 1011 S Ocean Blvd Unit 301 PALMETTO DUNES
- 910 S Ocean Blvd
- 909 Perrin Dr Unit Oceanwalk C
- 1010 Perrin Dr Unit Q
- 908 S Ocean Blvd
- 909 S Ocean Blvd Unit 205
- 817 S Ocean Blvd Unit 201
- 914 Hillside Dr S Unit T
- 927 Edge Dr
- 1208 S Ocean Blvd Unit I
- 223 9th Ave S
- 948A Perrin Dr Unit 1
- 948 Perrin Dr Unit 13
- 948-A Perrin Dr Unit Ocean Drive Dunes
- 948 Perrin Dr Unit Ocean Drive Dunes Un
- 948 Perrin Dr Unit 14 Ocean Drive Dunes
- 948 Perrin Dr Unit 2 Ocean Drive Dunes
- 948 Perrin Dr Unit Ocean Drive Dunes 1
- 948 Perrin Dr Unit 2 Ocean Drive D
- 948 Perrin Dr Unit 6 Ocean Drive D
- 948 Perrin Dr
- 948A Perrin Dr Unit 8
- 948 Perrin Dr Unit 4
- 948 Perrin Dr Unit 18
- 948A Perrin Dr Unit 2
- 948 Perrin Dr Unit 19
- 948-A Perrin Dr Unit 2
- 948 Perrin Dr Unit B21
- 948 Perrin Dr Unit 5
- 948 Perrin Dr Unit 21 Ocean Drive
- 948-A Perrin Dr Unit 2 Ocean Drive Dunes