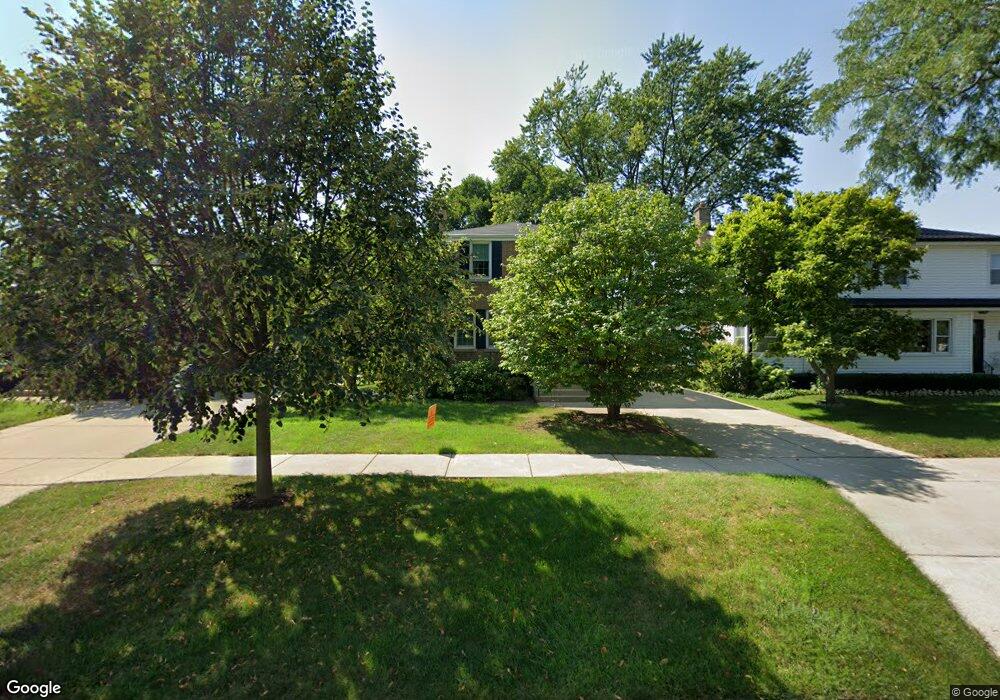
948 S Spring Rd Elmhurst, IL 60126
Estimated Value: $442,000 - $612,000
Studio
--
Bath
1,494
Sq Ft
$336/Sq Ft
Est. Value
About This Home
This home is located at 948 S Spring Rd, Elmhurst, IL 60126 and is currently estimated at $501,314, approximately $335 per square foot. 948 S Spring Rd is a home located in DuPage County with nearby schools including Jackson Elementary School, Bryan Middle School, and York Community High School.
Create a Home Valuation Report for This Property
The Home Valuation Report is an in-depth analysis detailing your home's value as well as a comparison with similar homes in the area
Home Values in the Area
Average Home Value in this Area
Tax History
| Year | Tax Paid | Tax Assessment Tax Assessment Total Assessment is a certain percentage of the fair market value that is determined by local assessors to be the total taxable value of land and additions on the property. | Land | Improvement |
|---|---|---|---|---|
| 2024 | $8,533 | $157,593 | $61,121 | $96,472 |
| 2023 | $7,876 | $145,730 | $56,520 | $89,210 |
| 2022 | $7,827 | $140,070 | $54,330 | $85,740 |
| 2021 | $7,623 | $136,590 | $52,980 | $83,610 |
| 2020 | $7,320 | $133,600 | $51,820 | $81,780 |
| 2019 | $7,147 | $127,020 | $49,270 | $77,750 |
| 2018 | $6,732 | $114,660 | $46,630 | $68,030 |
| 2017 | $6,579 | $109,260 | $44,430 | $64,830 |
| 2016 | $6,434 | $102,930 | $41,860 | $61,070 |
| 2015 | $6,362 | $95,890 | $39,000 | $56,890 |
| 2014 | $7,158 | $98,890 | $35,610 | $63,280 |
| 2013 | $7,082 | $100,280 | $36,110 | $64,170 |
Source: Public Records
Map
Nearby Homes
- 868 S Spring Rd
- 936 S Mitchell Ave
- 849 S Swain Ave
- 878 S Parkside Ave
- 881 S Bryan St
- 745 S Hillside Ave
- 742 S Saylor Ave
- 769 S Fairview Ave
- 101 W Jackson St
- 465 W Verret St
- 110 W Butterfield Rd Unit 502S
- 857 S Euclid Ave
- 1200 S Prospect Ave Unit 108
- 722 S Berkley Ave
- 696 S Prospect Ave
- 688 S Mitchell Ave
- 680 S Bryan St
- 1S045 Spring Rd Unit H2
- 1S045 Spring Rd Unit 1D
- 1S055 Spring Rd Unit 2C
- 952 S Spring Rd
- 936 S Spring Rd
- 934 S Spring Rd
- 945 S Hillside Ave
- 960 S Spring Rd
- 941 S Hillside Ave
- 949 S Hillside Ave
- 937 S Hillside Ave
- 953 S Hillside Ave
- 945 S Spring Rd
- 964 S Spring Rd
- 949 S Spring Rd
- 939 S Spring Rd
- 932 S Spring Rd
- 953 S Spring Rd
- 288 W Van Buren St
- 957 S Spring Rd
- 968 S Spring Rd
- 961 S Hillside Ave
- 965 S Hillside Ave
Your Personal Tour Guide
Ask me questions while you tour the home.