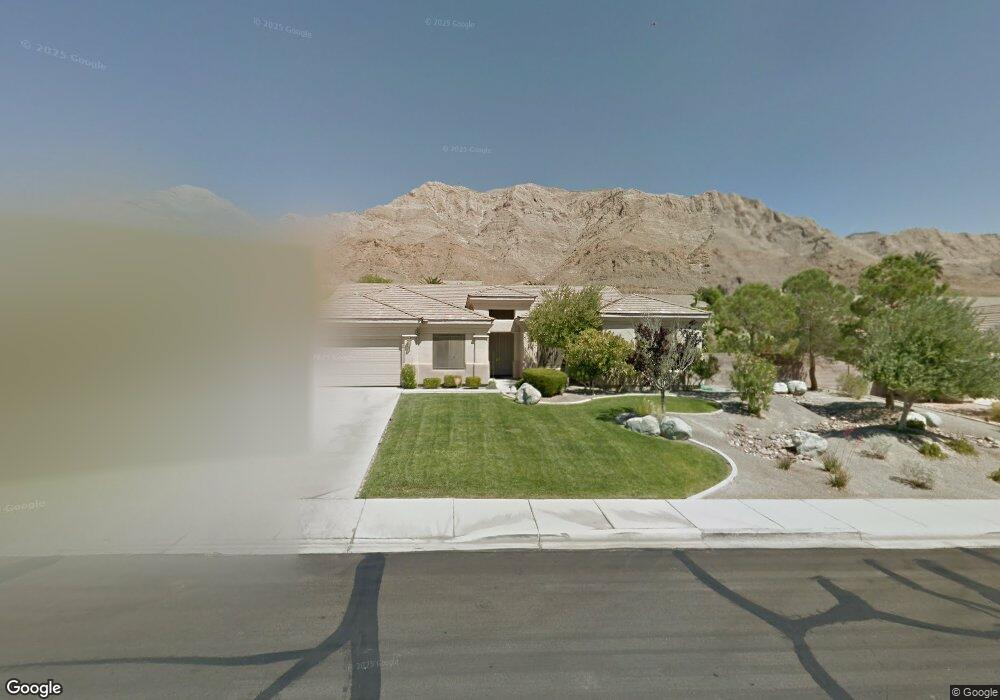
948 Temple View Dr Las Vegas, NV 89110
Estimated Value: $609,987 - $741,000
4
Beds
3
Baths
2,943
Sq Ft
$237/Sq Ft
Est. Value
About This Home
This home is located at 948 Temple View Dr, Las Vegas, NV 89110 and is currently estimated at $696,497, approximately $236 per square foot. 948 Temple View Dr is a home located in Clark County with nearby schools including Eileen Brookman Elementary School, Dr. William H. Bailey Middle School, and Eldorado High School.
Ownership History
Date
Name
Owned For
Owner Type
Purchase Details
Closed on
May 21, 2004
Sold by
Chamberlain Alan K and Chamberlain Yvonne
Bought by
Chamberlain Alan K and Chamberlain Yvonne
Current Estimated Value
Purchase Details
Closed on
Jul 29, 2001
Sold by
Sanderson James A and Sanderson Sharon K
Bought by
Chamberlain Alan K and Chamberlain Yvonne
Home Financials for this Owner
Home Financials are based on the most recent Mortgage that was taken out on this home.
Original Mortgage
$274,500
Outstanding Balance
$107,388
Interest Rate
7.19%
Estimated Equity
$589,110
Purchase Details
Closed on
Jun 16, 1998
Sold by
Del Webbs Coventry Homes Of Nevada Inc
Bought by
Sanderson James A and Sanderson Sharon K
Home Financials for this Owner
Home Financials are based on the most recent Mortgage that was taken out on this home.
Original Mortgage
$271,350
Interest Rate
7.11%
Create a Home Valuation Report for This Property
The Home Valuation Report is an in-depth analysis detailing your home's value as well as a comparison with similar homes in the area
Home Values in the Area
Average Home Value in this Area
Purchase History
| Date | Buyer | Sale Price | Title Company |
|---|---|---|---|
| Chamberlain Alan K | -- | Stewart Title Of Nevada | |
| Chamberlain Alan K | $309,900 | Stewart Title | |
| Sanderson James A | $226,000 | First American Title Co |
Source: Public Records
Mortgage History
| Date | Status | Borrower | Loan Amount |
|---|---|---|---|
| Open | Chamberlain Alan K | $274,500 | |
| Previous Owner | Sanderson James A | $271,350 |
Source: Public Records
Tax History Compared to Growth
Tax History
| Year | Tax Paid | Tax Assessment Tax Assessment Total Assessment is a certain percentage of the fair market value that is determined by local assessors to be the total taxable value of land and additions on the property. | Land | Improvement |
|---|---|---|---|---|
| 2025 | $3,821 | $161,560 | $56,000 | $105,560 |
| 2024 | $3,539 | $161,560 | $56,000 | $105,560 |
| 2023 | $3,539 | $152,595 | $52,500 | $100,095 |
| 2022 | $3,277 | $139,027 | $47,250 | $91,777 |
| 2021 | $3,171 | $125,791 | $38,500 | $87,291 |
| 2020 | $2,815 | $125,067 | $38,500 | $86,567 |
| 2019 | $2,638 | $120,513 | $35,000 | $85,513 |
| 2018 | $2,517 | $114,016 | $31,500 | $82,516 |
| 2017 | $3,279 | $111,808 | $28,000 | $83,808 |
| 2016 | $2,356 | $85,455 | $21,000 | $64,455 |
| 2015 | $2,351 | $83,820 | $21,000 | $62,820 |
| 2014 | $2,283 | $75,518 | $14,000 | $61,518 |
Source: Public Records
Map
Nearby Homes
- 956 Sugar Springs Dr
- 1086 Eastridge Way
- 2050 N Los Feliz St Unit 102
- 2050 N Los Feliz St Unit 162
- 2050 N Los Feliz St Unit 176
- 853 Morning Sun Ct
- 1166 Panorama Heights St
- 1030 Pearl Peak St
- 1345 Morning Sun Way
- 1239 N Hollywood Blvd
- 738 Rossmore Dr
- 650 N Hollywood Blvd
- 1083 Sterling Peak St
- 1330 Honey Lake St
- 706 N Hollywood Blvd
- 807 Sun Shimmer Place
- 6561 Alma White St
- 6538 Astorville Ct
- 6502 Bristle Canyon Ave
- 6958 Lazy Sunset Ct
- 940 Temple View Dr
- 956 Temple View Dr
- 947 Evening Dew Dr
- 932 Temple View Dr
- 964 Temple View Dr
- 939 Evening Dew Dr
- 955 Evening Dew Dr
- 947 Temple View Dr
- 955 Temple View Dr
- 939 Temple View Dr
- 931 Evening Dew Dr
- 963 Evening Dew Dr
- 972 Temple View Dr
- 924 Temple View Dr
- 963 Temple View Dr
- 971 Evening Dew Dr
- 923 Evening Dew Dr
- 971 Temple View Dr
- 923 Temple View Dr
- 980 Temple View Dr