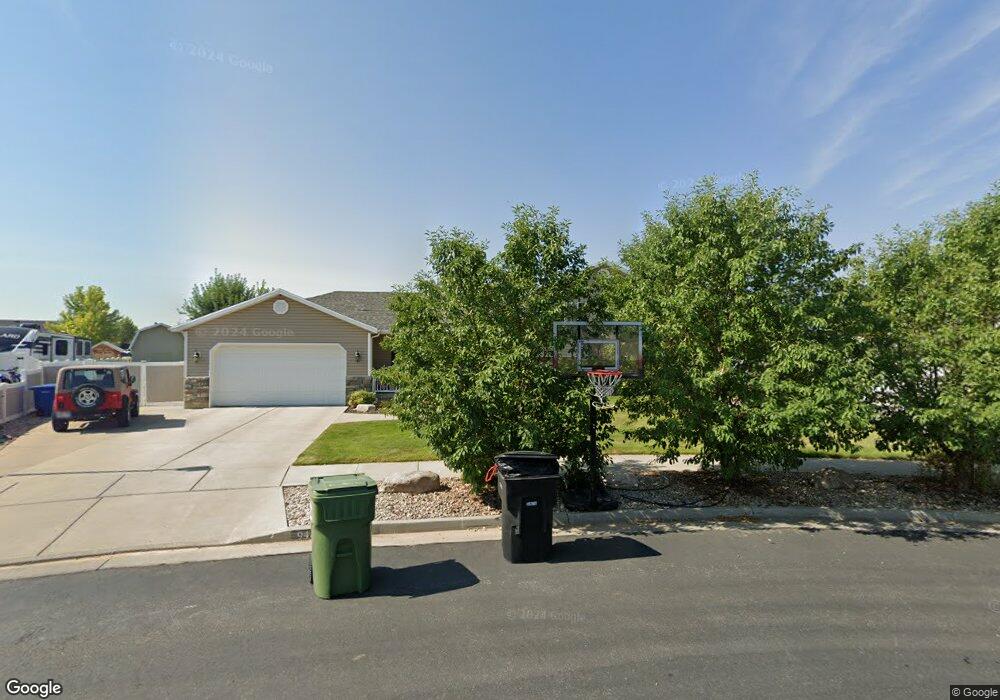
948 W 2675 S Nibley, UT 84321
Estimated Value: $394,000 - $470,203
4
Beds
2
Baths
1,898
Sq Ft
$232/Sq Ft
Est. Value
About This Home
This home is located at 948 W 2675 S, Nibley, UT 84321 and is currently estimated at $441,051, approximately $232 per square foot. 948 W 2675 S is a home located in Cache County with nearby schools including Nibley School, Spring Creek Middle School, and South Cache Middle School.
Ownership History
Date
Name
Owned For
Owner Type
Purchase Details
Closed on
Apr 19, 2018
Sold by
Thompson Brenden D and Thompson Cari H
Bought by
Alder Kip and Alder Cindy
Current Estimated Value
Home Financials for this Owner
Home Financials are based on the most recent Mortgage that was taken out on this home.
Original Mortgage
$195,750
Outstanding Balance
$168,381
Interest Rate
4.45%
Mortgage Type
New Conventional
Estimated Equity
$272,670
Purchase Details
Closed on
May 19, 2008
Sold by
Neighborhood Nonprofit Housing Corporati
Bought by
Thompson Brenden D and Thompson Cari H
Home Financials for this Owner
Home Financials are based on the most recent Mortgage that was taken out on this home.
Original Mortgage
$164,722
Interest Rate
5.88%
Mortgage Type
Purchase Money Mortgage
Create a Home Valuation Report for This Property
The Home Valuation Report is an in-depth analysis detailing your home's value as well as a comparison with similar homes in the area
Home Values in the Area
Average Home Value in this Area
Purchase History
| Date | Buyer | Sale Price | Title Company |
|---|---|---|---|
| Alder Kip | -- | Pinnacle Title | |
| Thompson Brenden D | -- | Cache Title Company |
Source: Public Records
Mortgage History
| Date | Status | Borrower | Loan Amount |
|---|---|---|---|
| Open | Alder Kip | $195,750 | |
| Previous Owner | Thompson Brenden D | $164,722 |
Source: Public Records
Tax History Compared to Growth
Tax History
| Year | Tax Paid | Tax Assessment Tax Assessment Total Assessment is a certain percentage of the fair market value that is determined by local assessors to be the total taxable value of land and additions on the property. | Land | Improvement |
|---|---|---|---|---|
| 2024 | $194 | $241,170 | $0 | $0 |
| 2023 | $2,128 | $229,005 | $0 | $0 |
| 2022 | $221 | $247,940 | $0 | $0 |
| 2021 | $2,029 | $352,773 | $69,800 | $282,973 |
| 2020 | $1,908 | $315,864 | $69,800 | $246,064 |
| 2019 | $2,001 | $315,864 | $69,800 | $246,064 |
| 2018 | $1,722 | $265,200 | $45,500 | $219,700 |
| 2017 | $1,459 | $118,965 | $0 | $0 |
| 2016 | $1,475 | $93,680 | $0 | $0 |
| 2015 | $1,154 | $93,680 | $0 | $0 |
| 2014 | $1,128 | $93,680 | $0 | $0 |
| 2013 | -- | $93,605 | $0 | $0 |
Source: Public Records
Map
Nearby Homes
- 1065 W 2740 S
- 2662 S 850 W
- 3074 S 800 W
- 2814 S 1150 W
- 2899 S 1080 W
- 907 W 2980 S
- 1045 W 2400 S
- 2615 S 600 W
- 2485 S 1296 W
- 2938 S 600 W
- 1389 W 2870 S
- 2269 Clear Creek Rd
- 2313 S 1000 W Unit 110
- 2205 S 1120 W Unit 62
- 2203 S 1150 W Unit 43
- Briarwood Plan at Firefly Estates
- Phoenix Plan at Firefly Estates
- Hailey Plan at Firefly Estates
- Stansbury Plan at Firefly Estates
- Monroe Plan at Firefly Estates