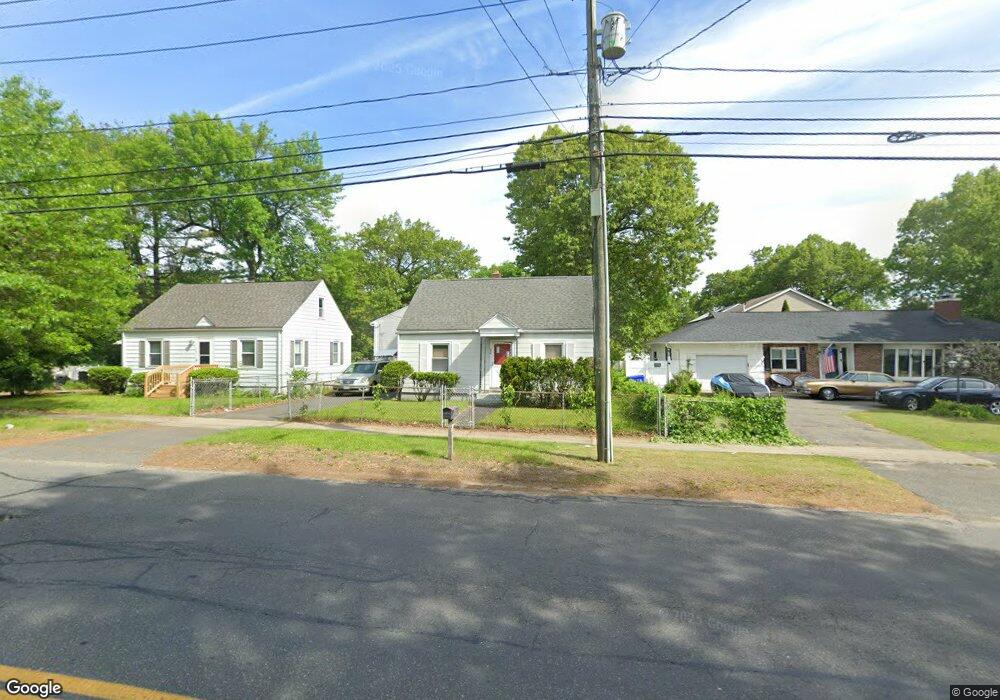
948 Wilbraham Rd Springfield, MA 01109
Sixteen Acres NeighborhoodEstimated Value: $210,000 - $233,287
2
Beds
1
Bath
864
Sq Ft
$260/Sq Ft
Est. Value
About This Home
This home is located at 948 Wilbraham Rd, Springfield, MA 01109 and is currently estimated at $225,072, approximately $260 per square foot. 948 Wilbraham Rd is a home located in Hampden County with nearby schools including Frank H. Freedman School, John J Duggan Middle, and Springfield High School of Science and Technology.
Ownership History
Date
Name
Owned For
Owner Type
Purchase Details
Closed on
Oct 12, 2011
Sold by
Depiero John C
Bought by
Johnson Jeremiah J
Current Estimated Value
Home Financials for this Owner
Home Financials are based on the most recent Mortgage that was taken out on this home.
Original Mortgage
$52,847
Outstanding Balance
$36,303
Interest Rate
4.25%
Mortgage Type
Purchase Money Mortgage
Estimated Equity
$188,769
Purchase Details
Closed on
Aug 14, 2006
Sold by
Radtke Rose C
Bought by
Depiero John C
Create a Home Valuation Report for This Property
The Home Valuation Report is an in-depth analysis detailing your home's value as well as a comparison with similar homes in the area
Home Values in the Area
Average Home Value in this Area
Purchase History
| Date | Buyer | Sale Price | Title Company |
|---|---|---|---|
| Johnson Jeremiah J | $75,100 | -- | |
| Depiero John C | -- | -- |
Source: Public Records
Mortgage History
| Date | Status | Borrower | Loan Amount |
|---|---|---|---|
| Open | Johnson Jeremiah J | $52,847 |
Source: Public Records
Tax History
| Year | Tax Paid | Tax Assessment Tax Assessment Total Assessment is a certain percentage of the fair market value that is determined by local assessors to be the total taxable value of land and additions on the property. | Land | Improvement |
|---|---|---|---|---|
| 2025 | $3,081 | $196,500 | $50,900 | $145,600 |
| 2024 | $2,791 | $173,800 | $50,900 | $122,900 |
| 2023 | $2,774 | $162,700 | $48,400 | $114,300 |
| 2022 | $2,657 | $141,200 | $48,400 | $92,800 |
| 2021 | $2,591 | $137,100 | $44,000 | $93,100 |
| 2020 | $2,492 | $127,600 | $44,000 | $83,600 |
| 2019 | $2,310 | $117,400 | $44,000 | $73,400 |
| 2018 | $2,393 | $121,600 | $44,000 | $77,600 |
| 2017 | $2,426 | $123,400 | $48,500 | $74,900 |
| 2016 | $2,212 | $112,500 | $48,500 | $64,000 |
| 2015 | $2,272 | $115,500 | $48,500 | $67,000 |
Source: Public Records
Map
Nearby Homes
Your Personal Tour Guide
Ask me questions while you tour the home.