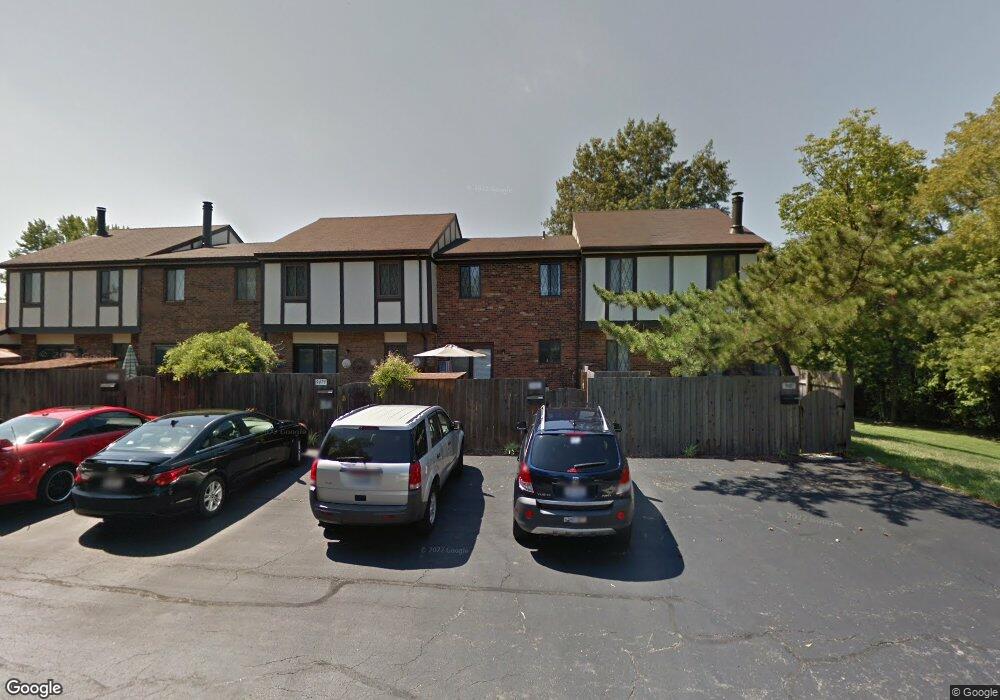
9481 Haddington Ct Unit 243 Cincinnati, OH 45251
Estimated Value: $141,000 - $152,789
2
Beds
2
Baths
1,252
Sq Ft
$117/Sq Ft
Est. Value
About This Home
This home is located at 9481 Haddington Ct Unit 243, Cincinnati, OH 45251 and is currently estimated at $146,697, approximately $117 per square foot. 9481 Haddington Ct Unit 243 is a home located in Hamilton County with nearby schools including Taylor Elementary School, Colerain Elementary School, and Colerain Middle School.
Ownership History
Date
Name
Owned For
Owner Type
Purchase Details
Closed on
Oct 15, 2021
Sold by
Bruns Sandra
Bought by
Dickerson April E and Dickerson Anthony B
Current Estimated Value
Home Financials for this Owner
Home Financials are based on the most recent Mortgage that was taken out on this home.
Original Mortgage
$117,826
Outstanding Balance
$107,446
Interest Rate
2.8%
Mortgage Type
FHA
Estimated Equity
$39,251
Purchase Details
Closed on
Dec 12, 2007
Sold by
Lind Philip L
Bought by
Bruns Sandra
Home Financials for this Owner
Home Financials are based on the most recent Mortgage that was taken out on this home.
Original Mortgage
$83,600
Interest Rate
6.31%
Mortgage Type
Unknown
Purchase Details
Closed on
Mar 31, 2005
Sold by
Hanes Norma J
Bought by
Lind Greg
Home Financials for this Owner
Home Financials are based on the most recent Mortgage that was taken out on this home.
Original Mortgage
$87,300
Interest Rate
5.71%
Mortgage Type
FHA
Create a Home Valuation Report for This Property
The Home Valuation Report is an in-depth analysis detailing your home's value as well as a comparison with similar homes in the area
Home Values in the Area
Average Home Value in this Area
Purchase History
| Date | Buyer | Sale Price | Title Company |
|---|---|---|---|
| Dickerson April E | $120,000 | None Available | |
| Bruns Sandra | $88,000 | Commitment Title Agency Inc | |
| Lind Greg | $90,000 | None Available |
Source: Public Records
Mortgage History
| Date | Status | Borrower | Loan Amount |
|---|---|---|---|
| Open | Dickerson April E | $117,826 | |
| Previous Owner | Bruns Sandra | $83,600 | |
| Previous Owner | Lind Greg | $87,300 |
Source: Public Records
Tax History Compared to Growth
Tax History
| Year | Tax Paid | Tax Assessment Tax Assessment Total Assessment is a certain percentage of the fair market value that is determined by local assessors to be the total taxable value of land and additions on the property. | Land | Improvement |
|---|---|---|---|---|
| 2024 | $2,242 | $42,000 | $5,950 | $36,050 |
| 2023 | $2,256 | $42,000 | $5,950 | $36,050 |
| 2022 | $1,668 | $25,302 | $3,444 | $21,858 |
| 2021 | $1,653 | $25,302 | $3,444 | $21,858 |
| 2020 | $1,671 | $25,302 | $3,444 | $21,858 |
| 2019 | $1,456 | $20,570 | $2,800 | $17,770 |
| 2018 | $1,306 | $20,570 | $2,800 | $17,770 |
| 2017 | $1,237 | $20,570 | $2,800 | $17,770 |
| 2016 | $966 | $15,821 | $3,168 | $12,653 |
| 2015 | $975 | $15,821 | $3,168 | $12,653 |
| 2014 | $977 | $15,821 | $3,168 | $12,653 |
| 2013 | $1,384 | $23,608 | $4,725 | $18,883 |
Source: Public Records
Map
Nearby Homes
- 9446 Haddington Ct
- 3151 Birchway Dr Unit 3151
- 9558 Woodstate Dr Unit 13E
- 9568 Woodstate Dr
- 3463 Amberway Ct
- 3258 Lillwood Ln
- 3246 Ainsworth Dr
- 3275 Deshler Dr
- 3351 Deshler Dr
- 3276 Deshler Dr
- 9302 Loralinda Dr
- 9717 Loralinda Dr
- 3205 Donnybrook Ln
- 3119 Deshler Dr
- 9784 Loralinda Dr
- 3013 Niagara St
- 9126 Round Top Rd
- 9125 Round Top Rd
- 9828 Loralinda Dr
- 3545 Alamosa Dr
- 9475 Haddington Ct
- 9477 Haddington Ct
- 9483 Haddington Ct
- 9477 Haddington Ct Unit 241
- 9479 Haddington Ct
- 9473 Haddington Ct Unit 239
- 9467 Haddington Ct
- 9461 Haddington Ct Unit 233
- 9463 Haddington Ct Unit 234
- 9465 Haddington Ct
- 9469 Haddington Ct
- 9471 Haddington Ct
- 9487 Haddington Ct
- 9491 Haddington Ct
- 9485 Haddington Ct
- 9489 Haddington Ct
- 9495 Haddington Ct
- 9499 Haddington Ct
- 9497 Haddington Ct
- 9493 Haddington Ct