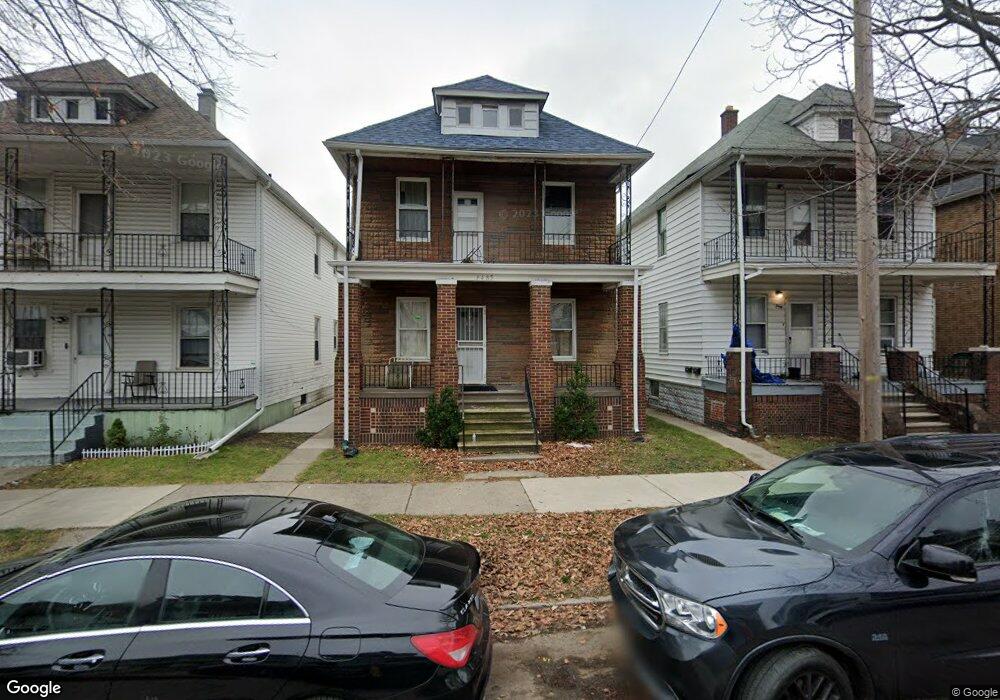
9485 Mcdougall St HamtraMcK, MI 48212
Estimated Value: $271,076 - $329,000
4
Beds
--
Bath
1,320
Sq Ft
$232/Sq Ft
Est. Value
About This Home
This home is located at 9485 Mcdougall St, HamtraMcK, MI 48212 and is currently estimated at $306,519, approximately $232 per square foot. 9485 Mcdougall St is a home located in Wayne County with nearby schools including Dickinson East Elementary School, Kosciuszko Middle School, and Hamtramck High School.
Ownership History
Date
Name
Owned For
Owner Type
Purchase Details
Closed on
Jun 19, 2013
Sold by
Mjalli Najib Amin and Muharram Arwa
Bought by
Mashrah Nabeel
Current Estimated Value
Purchase Details
Closed on
Sep 23, 2010
Sold by
Mjalli Najib Amin
Bought by
Mjalli Najib Amin and Mashrah Nabeel
Purchase Details
Closed on
Jun 8, 2010
Sold by
Bac Home Loans Servicing Lp
Bought by
Federal National Mortgage Association
Purchase Details
Closed on
Apr 14, 2010
Sold by
Farron Kristen C
Bought by
Bac Home Loans Servicing Lp
Purchase Details
Closed on
Oct 2, 2006
Sold by
Balic Mehmed and Balic Minka
Bought by
Farron Kristen C
Create a Home Valuation Report for This Property
The Home Valuation Report is an in-depth analysis detailing your home's value as well as a comparison with similar homes in the area
Home Values in the Area
Average Home Value in this Area
Purchase History
| Date | Buyer | Sale Price | Title Company |
|---|---|---|---|
| Mashrah Nabeel | -- | None Available | |
| Mjalli Najib Amin | -- | None Available | |
| Federal National Mortgage Association | -- | None Available | |
| Bac Home Loans Servicing Lp | $82,575 | None Available | |
| Farron Kristen C | $98,000 | Enterprise Title |
Source: Public Records
Tax History Compared to Growth
Tax History
| Year | Tax Paid | Tax Assessment Tax Assessment Total Assessment is a certain percentage of the fair market value that is determined by local assessors to be the total taxable value of land and additions on the property. | Land | Improvement |
|---|---|---|---|---|
| 2025 | $1,086 | $147,400 | $0 | $0 |
| 2024 | $1,086 | $127,400 | $0 | $0 |
| 2023 | $1,256 | $106,000 | $0 | $0 |
| 2022 | $1,075 | $92,200 | $0 | $0 |
| 2021 | $1,218 | $75,300 | $0 | $0 |
| 2020 | $1,209 | $65,200 | $0 | $0 |
| 2019 | $1,198 | $52,800 | $0 | $0 |
| 2018 | $918 | $30,000 | $0 | $0 |
| 2017 | $496 | $23,300 | $0 | $0 |
| 2016 | $1,135 | $20,600 | $0 | $0 |
| 2015 | $1,960 | $19,600 | $0 | $0 |
| 2013 | $1,950 | $19,500 | $0 | $0 |
| 2012 | $1,256 | $21,800 | $2,800 | $19,000 |
Source: Public Records
Map
Nearby Homes
- 2932 Evaline St
- 2689 Edwin St
- 3321 Doremus St
- 3096 Belmont St
- 2974 Trowbridge St
- 3360 Norwalk St
- 3031 Trowbridge St
- 2343 Evaline St
- 2997 Hanley St
- 3044 Hanley St
- 3017 Jacob St
- 3057 Jacob St
- 2971 Roosevelt St
- 2112 Belmont St
- 2227 Florian St
- 3170 Jacob St
- 2361 Caniff St
- 2143 Trowbridge St
- 2436 Hewitt St
- 3868 Doremus St
- 9479 Mcdougall St
- 9491 Mcdougall St
- 9473 Mcdougall St
- 9497 Mcdougall St
- 9467 Mcdougall St
- 9503 Mcdougall St
- 9482 Mitchell St
- 9461 Mcdougall St
- 9476 Mitchell St
- 9488 Mitchell St
- 9509 Mcdougall St
- 9470 Mitchell St
- 9494 Mitchell St
- 9464 Mitchell St
- 9455 Mcdougall St
- 9500 Mitchell St
- 9515 Mcdougall St
- 9484 Mcdougall St
- 9490 Mcdougall St
- 9458 Mitchell St