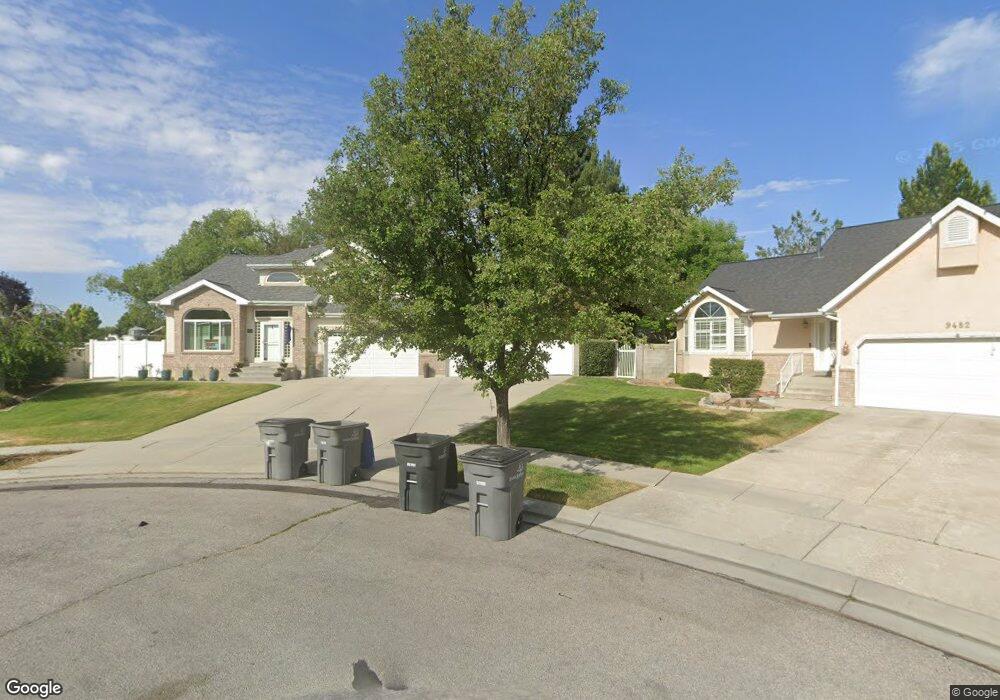
9488 Wasatch Downs Cir South Jordan, UT 84095
Estimated Value: $871,000 - $967,000
6
Beds
4
Baths
3,416
Sq Ft
$263/Sq Ft
Est. Value
About This Home
This home is located at 9488 Wasatch Downs Cir, South Jordan, UT 84095 and is currently estimated at $898,915, approximately $263 per square foot. 9488 Wasatch Downs Cir is a home located in Salt Lake County with nearby schools including South Jordan School, South Jordan Middle School, and Hawthorn Academy.
Ownership History
Date
Name
Owned For
Owner Type
Purchase Details
Closed on
Aug 12, 2002
Sold by
Compton Thomas W and Compton Kathryn V
Bought by
Joplin Cole M and Joplin Debra K
Current Estimated Value
Home Financials for this Owner
Home Financials are based on the most recent Mortgage that was taken out on this home.
Original Mortgage
$256,400
Outstanding Balance
$108,263
Interest Rate
6.52%
Estimated Equity
$790,652
Purchase Details
Closed on
May 20, 1994
Sold by
Pickens Leonard J
Bought by
Compton Thomas W and Compton Kathryn
Home Financials for this Owner
Home Financials are based on the most recent Mortgage that was taken out on this home.
Original Mortgage
$157,500
Interest Rate
8.52%
Purchase Details
Closed on
Oct 23, 1993
Sold by
Mcdougal Shaw Developers L C
Bought by
Pickens Leonard J
Home Financials for this Owner
Home Financials are based on the most recent Mortgage that was taken out on this home.
Original Mortgage
$159,000
Interest Rate
7.2%
Create a Home Valuation Report for This Property
The Home Valuation Report is an in-depth analysis detailing your home's value as well as a comparison with similar homes in the area
Home Values in the Area
Average Home Value in this Area
Purchase History
| Date | Buyer | Sale Price | Title Company |
|---|---|---|---|
| Joplin Cole M | -- | First American Title | |
| Compton Thomas W | -- | First American Title | |
| Pickens Leonard J | -- | -- |
Source: Public Records
Mortgage History
| Date | Status | Borrower | Loan Amount |
|---|---|---|---|
| Open | Joplin Cole M | $256,400 | |
| Previous Owner | Compton Thomas W | $157,500 | |
| Previous Owner | Pickens Leonard J | $159,000 |
Source: Public Records
Tax History Compared to Growth
Tax History
| Year | Tax Paid | Tax Assessment Tax Assessment Total Assessment is a certain percentage of the fair market value that is determined by local assessors to be the total taxable value of land and additions on the property. | Land | Improvement |
|---|---|---|---|---|
| 2025 | $3,939 | $839,100 | $394,200 | $444,900 |
| 2024 | $3,939 | $747,800 | $383,800 | $364,000 |
| 2023 | $4,045 | $724,600 | $305,600 | $419,000 |
| 2022 | $4,042 | $709,800 | $299,600 | $410,200 |
| 2021 | $3,504 | $564,500 | $240,500 | $324,000 |
| 2020 | $3,324 | $502,000 | $229,100 | $272,900 |
| 2019 | $3,288 | $488,000 | $216,100 | $271,900 |
| 2018 | $3,161 | $466,900 | $216,100 | $250,800 |
| 2017 | $3,022 | $437,500 | $216,100 | $221,400 |
| 2016 | $2,956 | $405,500 | $168,500 | $237,000 |
| 2015 | $2,865 | $382,100 | $179,800 | $202,300 |
| 2014 | $2,751 | $360,500 | $171,700 | $188,800 |
Source: Public Records
Map
Nearby Homes
- 8686 S Temple Dr
- 9532 S Willow Trail Way
- 1116 W 9440 S
- 9297 S Avignon Place
- 9847 S Castello Ct Unit 5
- 9635 S 1600 W
- 9141 S Little Creek Dr
- 1184 W Michaelsen Way
- 9909 Dream Cir
- 9095 S 1150 W
- 9837 Jordan Ridge Rd
- 9121 S Hidden Peak Dr
- 1719 W Brocious Way Unit 301
- 9511 S Tirado Cove Unit 204
- 9909 Reunion Glen Way
- 9847 S 1000 W
- 9909 W Reunion Ave
- 1718 W Thira Ln
- 1753 Rylie Ann Cir
- 1741 W Nikos Ln
- 9487 Wasatch Downs Cir
- 9527 S Temple Dr
- 9482 S Wasatch Downs Cir
- 9482 Wasatch Downs Cir
- 9501 S 1300 W
- 9468 Wasatch Downs Cir
- 9483 Wasatch Downs Cir
- 1271 Wasatch Downs Dr
- 1271 W Wasatch Downs Dr
- 9454 Wasatch Downs Cir
- 9481 Wasatch Downs Cir
- 9489 S 1300 W
- 9517 S 1300 W
- 9467 Wasatch Downs Cir
- 1281 Wasatch Downs Dr
- 1281 W Wasatch Downs Dr
- 1259 Wasatch Downs Dr
- 1259 W Wasatch Down Dr
- 1259 W 9440 S
- 9501 S Temple Dr