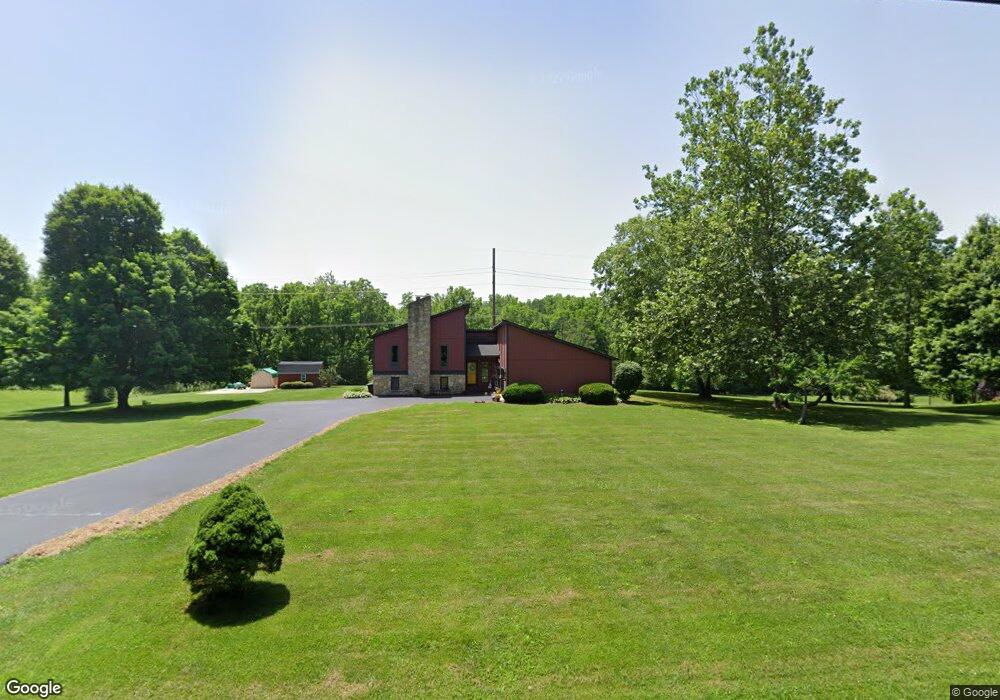
949 E Broadway St Danville, IN 46122
Estimated Value: $323,000 - $400,451
3
Beds
3
Baths
2,216
Sq Ft
$169/Sq Ft
Est. Value
About This Home
This home is located at 949 E Broadway St, Danville, IN 46122 and is currently estimated at $374,613, approximately $169 per square foot. 949 E Broadway St is a home located in Hendricks County with nearby schools including North Elementary School, South Elementary School, and Danville Middle School.
Ownership History
Date
Name
Owned For
Owner Type
Purchase Details
Closed on
Mar 21, 2020
Sold by
Terry Ginger and Tellefson Don A
Bought by
Terry Ginger and Terry Thomas
Current Estimated Value
Home Financials for this Owner
Home Financials are based on the most recent Mortgage that was taken out on this home.
Original Mortgage
$173,000
Interest Rate
3.4%
Mortgage Type
New Conventional
Purchase Details
Closed on
Jan 4, 2010
Sold by
Clason Randy C
Bought by
Clason Ginger
Home Financials for this Owner
Home Financials are based on the most recent Mortgage that was taken out on this home.
Original Mortgage
$144,051
Interest Rate
4.78%
Mortgage Type
FHA
Purchase Details
Closed on
Dec 31, 2009
Sold by
Clason Ginger V
Bought by
Clason Ginger and Tellefson Don A
Home Financials for this Owner
Home Financials are based on the most recent Mortgage that was taken out on this home.
Original Mortgage
$144,051
Interest Rate
4.78%
Mortgage Type
FHA
Create a Home Valuation Report for This Property
The Home Valuation Report is an in-depth analysis detailing your home's value as well as a comparison with similar homes in the area
Home Values in the Area
Average Home Value in this Area
Purchase History
| Date | Buyer | Sale Price | Title Company |
|---|---|---|---|
| Terry Ginger | -- | None Available | |
| Clason Ginger | -- | None Available | |
| Clason Ginger | -- | None Available |
Source: Public Records
Mortgage History
| Date | Status | Borrower | Loan Amount |
|---|---|---|---|
| Closed | Terry Ginger | $173,000 | |
| Closed | Clason Ginger | $144,051 |
Source: Public Records
Tax History
| Year | Tax Paid | Tax Assessment Tax Assessment Total Assessment is a certain percentage of the fair market value that is determined by local assessors to be the total taxable value of land and additions on the property. | Land | Improvement |
|---|---|---|---|---|
| 2025 | $2,872 | $284,900 | $66,600 | $218,300 |
| 2024 | $2,872 | $271,200 | $66,600 | $204,600 |
| 2023 | $2,604 | $244,800 | $60,500 | $184,300 |
| 2022 | $2,556 | $232,600 | $57,600 | $175,000 |
| 2021 | $2,362 | $212,100 | $57,600 | $154,500 |
| 2020 | $2,273 | $209,300 | $57,600 | $151,700 |
| 2019 | $2,146 | $199,700 | $48,000 | $151,700 |
| 2018 | $2,145 | $191,900 | $48,000 | $143,900 |
| 2017 | $2,051 | $181,300 | $45,900 | $135,400 |
| 2016 | $1,996 | $178,300 | $45,900 | $132,400 |
| 2014 | $1,850 | $166,200 | $44,500 | $121,700 |
Source: Public Records
Map
Nearby Homes
- 2056 Bouquet Dr
- 2036 Pheasant Grove Dr
- 0 No Address
- 185 N Washington St
- 1290 Tradition Ln
- 265 Raintree Dr
- 528 Hickory Dr
- 726 Oxford Ln
- 3042 Essex Dr
- 0 E Main St Unit MBR22041750
- 530 Old Farm Rd
- 4048 Radley Ct
- 2011 Knightsbridge Rd
- 335 Concord Dr E
- 263 Mackey Rd
- 1323 Money Ln
- 1356 Rutherglen Ct
- 1233 Bert Rd
- 246 Lucky Hat Ln
- 2051 Woodberry Dr
- 939 E Broadway St
- 950 E Broadway St
- 955 E Broadway St
- 940 E Broadway St
- 990 E Broadway St
- 680 E Broadway St
- 640 E Broadway St
- 660 E Broadway St
- 600 E Broadway St
- 550 E Broadway St
- 493 E Mill St
- 530 E Broadway St
- 555 E Broadway St
- 639 E Main St
- 445 E Mill St
- 525 E Broadway St
- 498 E Broadway St
- 519 E Broadway St
- 448 E Mill St
- 419 E Mill St
Your Personal Tour Guide
Ask me questions while you tour the home.