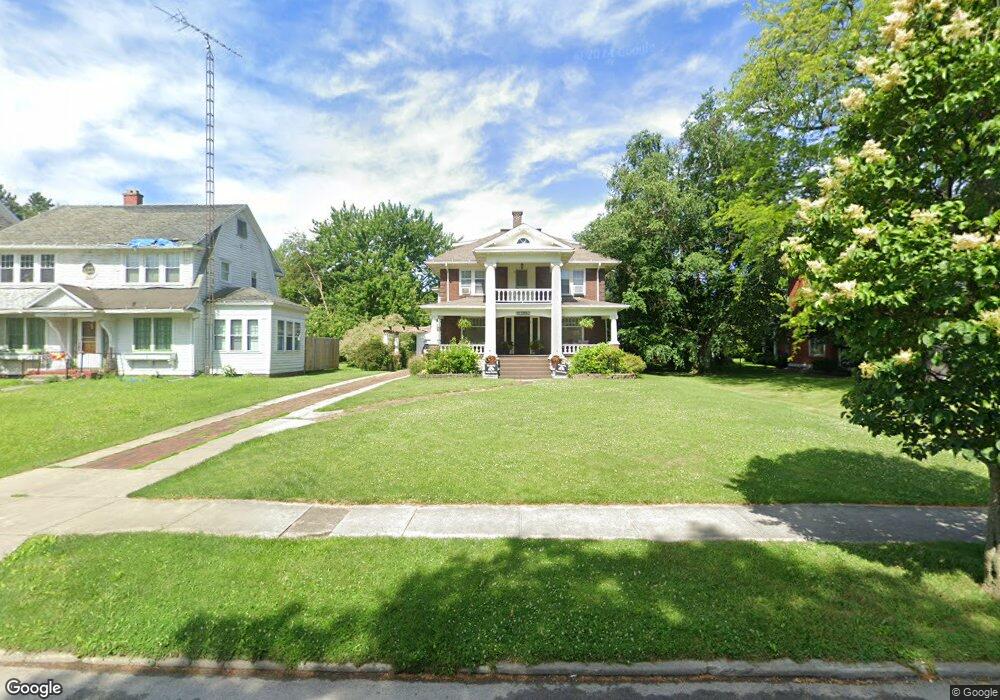
949 N Union St Fostoria, OH 44830
Estimated Value: $143,000 - $186,786
3
Beds
2
Baths
1,988
Sq Ft
$87/Sq Ft
Est. Value
About This Home
This home is located at 949 N Union St, Fostoria, OH 44830 and is currently estimated at $172,447, approximately $86 per square foot. 949 N Union St is a home located in Seneca County with nearby schools including Fostoria Intermediate Elementary School and Fostoria Junior/Senior High School.
Ownership History
Date
Name
Owned For
Owner Type
Purchase Details
Closed on
Jul 12, 2005
Sold by
Biddle Gregg E and Biddle Kimberly A
Bought by
Phillips Jocelyn S
Current Estimated Value
Home Financials for this Owner
Home Financials are based on the most recent Mortgage that was taken out on this home.
Original Mortgage
$123,400
Outstanding Balance
$64,749
Interest Rate
5.74%
Mortgage Type
New Conventional
Estimated Equity
$107,698
Purchase Details
Closed on
Apr 15, 1992
Sold by
H A Dalton & Company
Bought by
Biddle Kimberly A
Purchase Details
Closed on
Aug 27, 1991
Sold by
Dalton Hazel A
Bought by
H A Dalton & Company
Create a Home Valuation Report for This Property
The Home Valuation Report is an in-depth analysis detailing your home's value as well as a comparison with similar homes in the area
Home Values in the Area
Average Home Value in this Area
Purchase History
| Date | Buyer | Sale Price | Title Company |
|---|---|---|---|
| Phillips Jocelyn S | $129,900 | None Available | |
| Biddle Kimberly A | $75,000 | -- | |
| H A Dalton & Company | -- | -- |
Source: Public Records
Mortgage History
| Date | Status | Borrower | Loan Amount |
|---|---|---|---|
| Open | Phillips Jocelyn S | $123,400 |
Source: Public Records
Tax History Compared to Growth
Tax History
| Year | Tax Paid | Tax Assessment Tax Assessment Total Assessment is a certain percentage of the fair market value that is determined by local assessors to be the total taxable value of land and additions on the property. | Land | Improvement |
|---|---|---|---|---|
| 2024 | $3,074 | $59,030 | $6,170 | $52,860 |
| 2023 | $3,076 | $59,030 | $6,170 | $52,860 |
| 2022 | $2,337 | $39,520 | $5,110 | $34,410 |
| 2021 | $2,386 | $39,520 | $5,110 | $34,410 |
| 2020 | $2,396 | $39,523 | $5,114 | $34,409 |
| 2019 | $2,334 | $38,154 | $4,939 | $33,215 |
| 2018 | $2,378 | $38,154 | $4,939 | $33,215 |
| 2017 | $2,376 | $38,154 | $4,939 | $33,215 |
| 2016 | $2,041 | $36,474 | $5,019 | $31,455 |
| 2015 | $2,008 | $36,474 | $5,019 | $31,455 |
| 2014 | $1,916 | $36,474 | $5,019 | $31,455 |
| 2013 | $2,223 | $39,435 | $5,457 | $33,978 |
Source: Public Records
Map
Nearby Homes
- 931 N Union St
- 892 N Countyline St
- 900 N Countyline St
- 207 W Culbertson St
- 723 N Union St
- 1324 N Union St
- 633 Maple St
- 520 N Union St
- 375 Thomas St
- 901 Central Ave
- 603 N Vine St
- 727 Eisenhower Dr
- 540 N Poplar St
- 220 E High St
- 203 N Union St
- 827 Buckley St
- 509 College Ave
- 711 Circle Dr
- 348 W South St
- 351 W South St