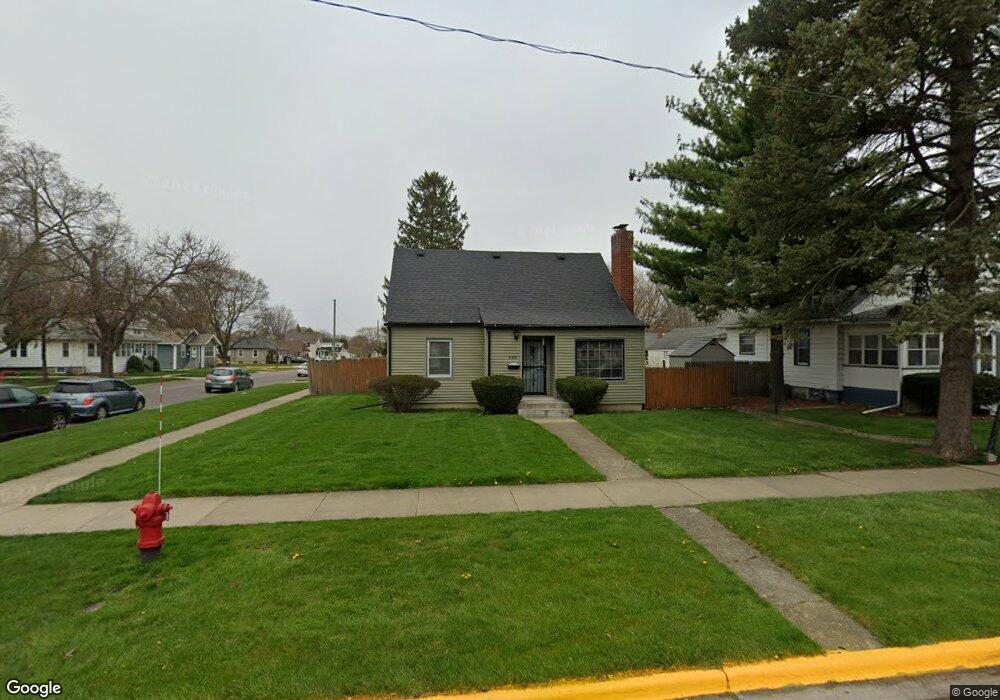
949 Spruce St Aurora, IL 60506
Blackhawk NeighborhoodEstimated Value: $255,000 - $265,000
3
Beds
1
Bath
1,260
Sq Ft
$208/Sq Ft
Est. Value
About This Home
This home is located at 949 Spruce St, Aurora, IL 60506 and is currently estimated at $261,734, approximately $207 per square foot. 949 Spruce St is a home located in Kane County with nearby schools including Greenman Elementary School, Jefferson Middle School, and West Aurora High School.
Ownership History
Date
Name
Owned For
Owner Type
Purchase Details
Closed on
Mar 12, 2003
Sold by
Mckinnie Allen and Mckennie Allen
Bought by
Mckennie Allen
Current Estimated Value
Home Financials for this Owner
Home Financials are based on the most recent Mortgage that was taken out on this home.
Original Mortgage
$120,197
Outstanding Balance
$49,789
Interest Rate
5.87%
Mortgage Type
FHA
Estimated Equity
$211,945
Purchase Details
Closed on
Oct 31, 2000
Sold by
Butler Richard A
Bought by
Mckinnie Allen
Home Financials for this Owner
Home Financials are based on the most recent Mortgage that was taken out on this home.
Original Mortgage
$118,027
Interest Rate
7.91%
Mortgage Type
FHA
Purchase Details
Closed on
Mar 27, 1997
Sold by
Butler Earlene J
Bought by
Butler Richard A
Home Financials for this Owner
Home Financials are based on the most recent Mortgage that was taken out on this home.
Original Mortgage
$71,250
Interest Rate
7.65%
Create a Home Valuation Report for This Property
The Home Valuation Report is an in-depth analysis detailing your home's value as well as a comparison with similar homes in the area
Home Values in the Area
Average Home Value in this Area
Purchase History
| Date | Buyer | Sale Price | Title Company |
|---|---|---|---|
| Mckennie Allen | -- | Transcontinental Title Compa | |
| Mckinnie Allen | $119,000 | First American Title Ins Co | |
| Butler Richard A | -- | First American Title Ins Co |
Source: Public Records
Mortgage History
| Date | Status | Borrower | Loan Amount |
|---|---|---|---|
| Open | Mckennie Allen | $120,197 | |
| Closed | Mckinnie Allen | $118,027 | |
| Previous Owner | Butler Richard A | $71,250 |
Source: Public Records
Tax History
| Year | Tax Paid | Tax Assessment Tax Assessment Total Assessment is a certain percentage of the fair market value that is determined by local assessors to be the total taxable value of land and additions on the property. | Land | Improvement |
|---|---|---|---|---|
| 2024 | $2,848 | $81,777 | $8,589 | $73,188 |
| 2023 | $3,081 | $73,067 | $7,674 | $65,393 |
| 2022 | $3,627 | $64,867 | $7,002 | $57,865 |
| 2021 | $3,743 | $60,392 | $6,519 | $53,873 |
| 2020 | $3,836 | $56,095 | $6,055 | $50,040 |
| 2019 | $4,495 | $51,973 | $5,610 | $46,363 |
| 2018 | $3,656 | $42,625 | $5,189 | $37,436 |
| 2017 | $3,232 | $37,408 | $4,781 | $32,627 |
| 2016 | $2,792 | $32,286 | $4,098 | $28,188 |
| 2015 | -- | $30,913 | $3,524 | $27,389 |
| 2014 | -- | $28,605 | $3,239 | $25,366 |
| 2013 | -- | $31,947 | $3,095 | $28,852 |
Source: Public Records
Map
Nearby Homes
- 950 Spruce St
- 930 W New York St Unit 932
- 850 W Galena Blvd
- 807 Spruce St
- 809 W Park Ave
- 1039 S Pleasure Ct
- 810 W Galena Blvd
- 710 W Downer Place
- 175 S Harrison Ave
- 160 Ingleside Ave
- 1104 New Haven Ave
- 544 Charles St
- 646-648 Hardin Ave
- 932 W New York St
- 541 Charles St
- 781 N Elmwood Dr
- 165 Franklin Ave
- 833 Sheldon Ave
- 210 S Gladstone Ave
- 231 W Downer Place
- 943 Spruce St
- 939 Spruce St
- 202 N Elmwood Dr
- 217 N Elmwood Dr
- 940 Charles St
- 935 Spruce St
- 938 Charles St
- 1007 Spruce St
- 212 N Elmwood Dr
- 932 Charles St
- 931 Spruce St
- 942 Spruce St
- 216 N Elmwood Dr
- 120 N Elmwood Dr
- 1011 Spruce St
- 938 Spruce St
- 928 Charles St
- 1010 Charles St
- 934 Spruce St
- 927 Spruce St