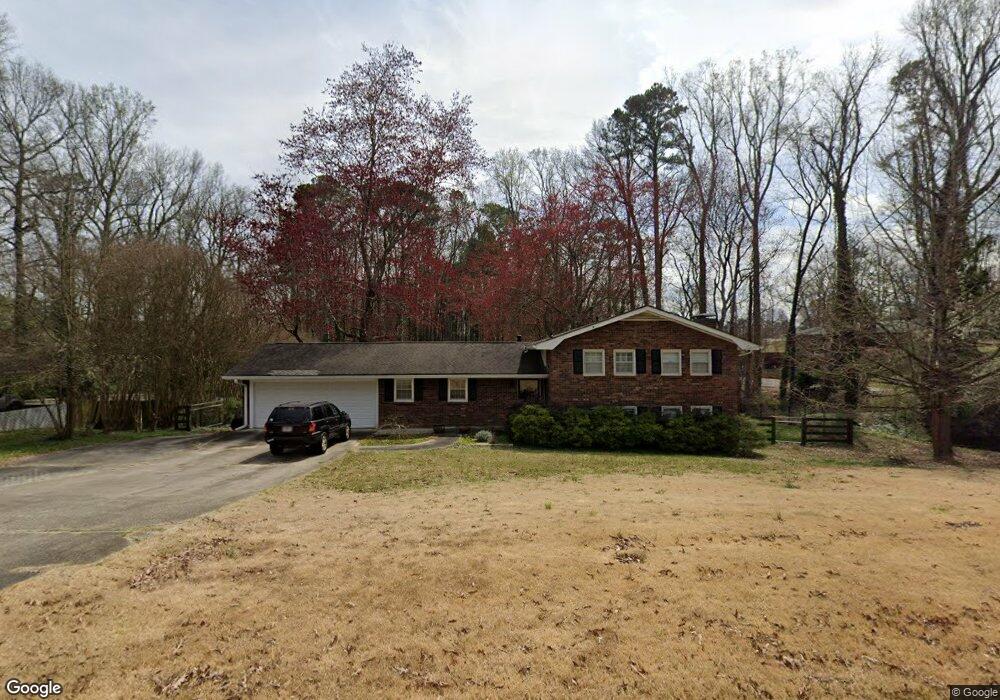
949 Tranquil Dr Unit 45 Austell, GA 30106
Estimated Value: $359,000 - $392,000
3
Beds
2
Baths
1,303
Sq Ft
$286/Sq Ft
Est. Value
About This Home
This home is located at 949 Tranquil Dr Unit 45, Austell, GA 30106 and is currently estimated at $372,263, approximately $285 per square foot. 949 Tranquil Dr Unit 45 is a home located in Cobb County with nearby schools including Russell Elementary School, Floyd Middle School, and Osborne High School.
Ownership History
Date
Name
Owned For
Owner Type
Purchase Details
Closed on
Jun 10, 2022
Sold by
Rachel Sheldon
Bought by
Beall Katie Anne
Current Estimated Value
Home Financials for this Owner
Home Financials are based on the most recent Mortgage that was taken out on this home.
Original Mortgage
$333,900
Outstanding Balance
$316,768
Interest Rate
5.1%
Mortgage Type
New Conventional
Estimated Equity
$55,495
Purchase Details
Closed on
Aug 25, 2016
Sold by
Camp Michael D and Camp Linda L
Bought by
Sheldon Ryan and Sheldon Rachel
Home Financials for this Owner
Home Financials are based on the most recent Mortgage that was taken out on this home.
Original Mortgage
$162,000
Interest Rate
3.48%
Mortgage Type
New Conventional
Purchase Details
Closed on
Aug 30, 1996
Sold by
Maxfield Chris C Joan S
Bought by
Camp Michael D Linda L
Create a Home Valuation Report for This Property
The Home Valuation Report is an in-depth analysis detailing your home's value as well as a comparison with similar homes in the area
Home Values in the Area
Average Home Value in this Area
Purchase History
| Date | Buyer | Sale Price | Title Company |
|---|---|---|---|
| Beall Katie Anne | $371,000 | None Listed On Document | |
| Sheldon Ryan | $180,000 | -- | |
| Camp Michael D Linda L | $17,000 | -- |
Source: Public Records
Mortgage History
| Date | Status | Borrower | Loan Amount |
|---|---|---|---|
| Open | Beall Katie Anne | $333,900 | |
| Previous Owner | Sheldon Ryan | $162,000 | |
| Closed | Camp Michael D Linda L | $0 |
Source: Public Records
Tax History
| Year | Tax Paid | Tax Assessment Tax Assessment Total Assessment is a certain percentage of the fair market value that is determined by local assessors to be the total taxable value of land and additions on the property. | Land | Improvement |
|---|---|---|---|---|
| 2025 | $3,881 | $150,992 | $30,000 | $120,992 |
| 2024 | $3,884 | $150,992 | $30,000 | $120,992 |
| 2023 | $2,967 | $133,704 | $22,000 | $111,704 |
Source: Public Records
Map
Nearby Homes
- 900 Tranquil Dr
- 860 Tranquil Dr
- 3601 Kelsey Chase Ct
- 3712 Auldyn Dr
- 1290 Yates Ave
- 3853 Felton Hill Rd SW Unit 9
- 971 Canyon Trail SW
- 3655 Rock Springs Dr SW
- 1430 Settlers Walk Way SW Unit 13
- 3720 Majestic Dr SW
- 3966 Covey Flush Ct SW Unit 20
- 3933 Covey Flush Ct SW Unit 25
- 3937 Covey Flush Ct SW Unit 25
- 602 Hurt Rd SW
- 1471 Settlers Walk Way SW Unit 5
- 3998 Llewellin Ln SW Unit 23
- 3585 Mill Creek Trail SW
- 625 Aunt Lucy Ln SW Unit 25
- 625 Aunt Lucy Ln SW Unit 41
- 580 Lee Ann Dr SW
- 949 Tranquil Dr
- TBD Tbd Tranquil Valley
- 939 Tranquil Dr Unit 44
- 939 Tranquil Dr
- 939 Tranquil Dr Unit ba
- 940 Tranquil Dr
- 3721 Pacific Dr
- 950 Tranquil Dr
- 930 Tranquil Dr
- 961 Tranquil Dr
- 909 Tranquil Dr
- 3741 Pacific Dr
- 920 Tranquil Dr
- 933 Hurt Rd
- 970 Tranquil Dr
- 879 Tranquil Dr
- 3710 Pacific Dr
- 3730 Pacific Dr
- 3720 Pacific Dr
- 921 Hurt Rd
Your Personal Tour Guide
Ask me questions while you tour the home.